

Question: 15. The following circle graph represents data from 1500 people. The sector angle for E is 144. Determine the frequency of category E. Show your
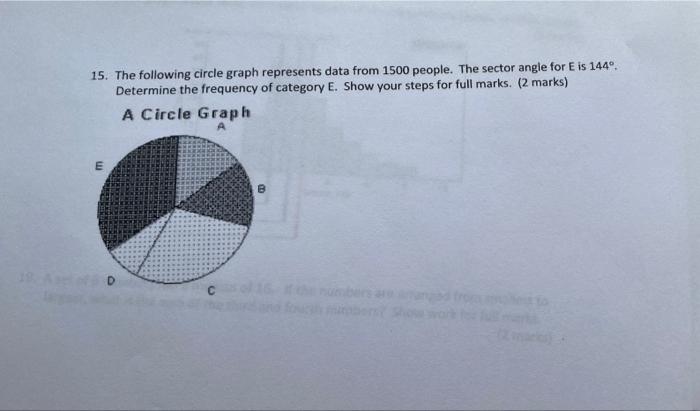
15. The following circle graph represents data from 1500 people. The sector angle for E is 144. Determine the frequency of category E. Show your steps for full marks. (2 marks) A Circle Graph E B D
Step by Step Solution
There are 3 Steps involved in it
1 Expert Approved Answer
Step: 1 Unlock

Question Has Been Solved by an Expert!
Get step-by-step solutions from verified subject matter experts
Step: 2 Unlock
Step: 3 Unlock