

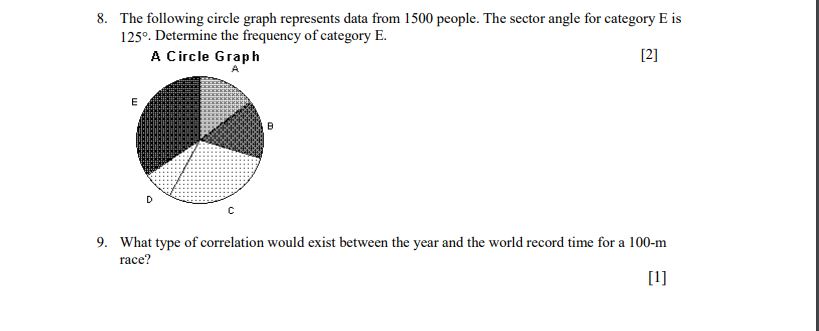
Question: Chapter 1 Test Revision E. The following circle graph represents data from 15GB people. The sector angle for category E is 125. Determine the frequency
Chapter 1 Test Revision

E. The following circle graph represents data from 15GB people. The sector angle for category E is 125. Determine the frequency of category E. A Circle Graph [2] A I: '9. What type of correlation wotd exist between the year and the worId record time for a IDELm race? [*1
Step by Step Solution
There are 3 Steps involved in it
1 Expert Approved Answer
Step: 1 Unlock

Question Has Been Solved by an Expert!
Get step-by-step solutions from verified subject matter experts
Step: 2 Unlock
Step: 3 Unlock