

Question: 1501 Suppose you train a model with gradient descent optimization multiple times using cross-validation. The results of the training and validation loss are plotted
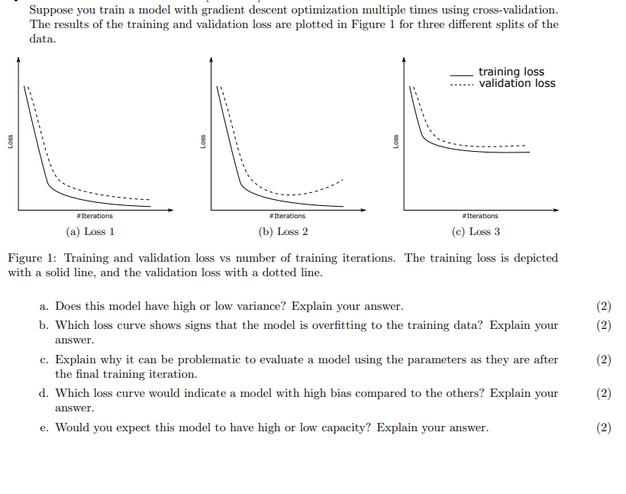
1501 Suppose you train a model with gradient descent optimization multiple times using cross-validation. The results of the training and validation loss are plotted in Figure 1 for three different splits of the data. #terations (a) Loss 1 5501 #Iterations (b) Loss 2 9901 training loss validation loss #Iterations (c) I 3 Figure 1: Training and validation loss vs number of training iterations. The training loss is depicted with a solid line, and the validation loss with a dotted line. a. Does this model have high or low variance? Explain your answer. b. Which loss curve shows signs that the model is overfitting to the training data? Explain your answer. c. Explain why it can be problematic to evaluate a model using the parameters as they are after the final training iteration. d. Which loss curve would indicate a model with high bias compared to the others? Explain your answer. e. Would you expect this model to have high or low capacity? Explain your answer. (2) (2) (2) (2) (2) 1501 Suppose you train a model with gradient descent optimization multiple times using cross-validation. The results of the training and validation loss are plotted in Figure 1 for three different splits of the data. #terations (a) Loss 1 5501 #Iterations (b) Loss 2 9901 training loss validation loss #Iterations (c) I 3 Figure 1: Training and validation loss vs number of training iterations. The training loss is depicted with a solid line, and the validation loss with a dotted line. a. Does this model have high or low variance? Explain your answer. b. Which loss curve shows signs that the model is overfitting to the training data? Explain your answer. c. Explain why it can be problematic to evaluate a model using the parameters as they are after the final training iteration. d. Which loss curve would indicate a model with high bias compared to the others? Explain your answer. e. Would you expect this model to have high or low capacity? Explain your answer. (2) (2) (2) (2) (2)
Step by Step Solution
There are 3 Steps involved in it
Based on the provided image which shows three graphs of training and validation loss versus the number of training iterations we can address the questions accordingly a Does this model have high or lo... View full answer

Get step-by-step solutions from verified subject matter experts