

Question: 16 ACTIVITY #1: ADVANCED GRAPHICAL ANALYSIS Overview: This activity is designed to help especially those students who have not taken Physics 093 or 101/111 remember


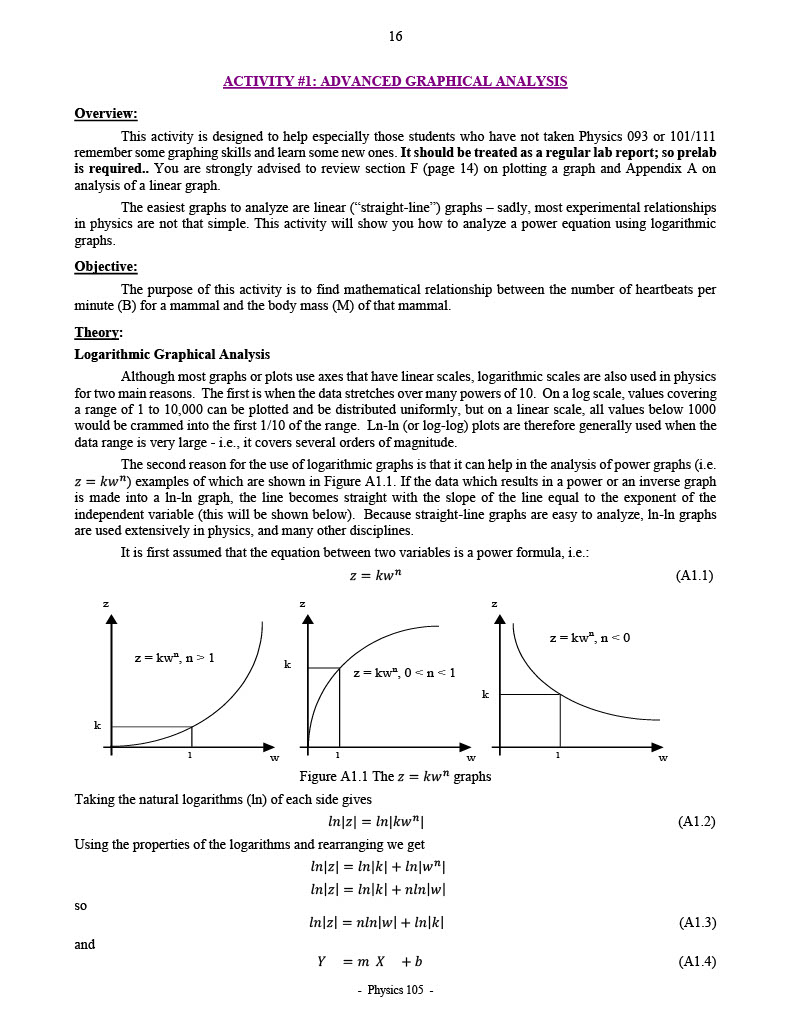
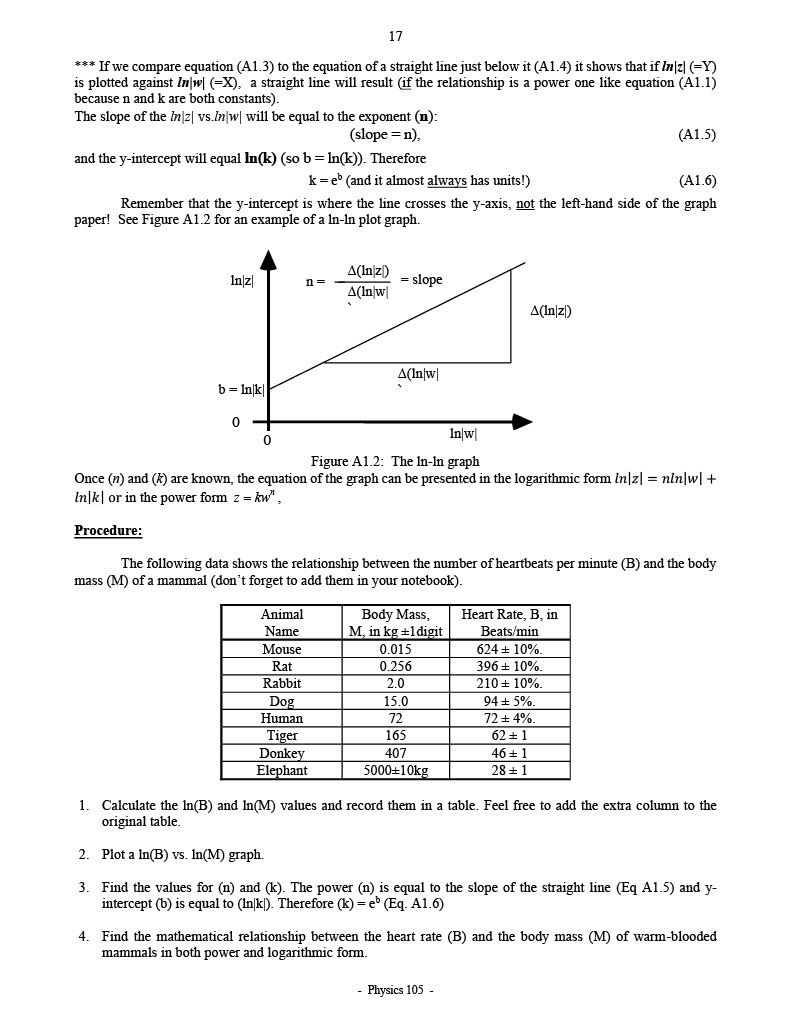

16 ACTIVITY #1: ADVANCED GRAPHICAL ANALYSIS Overview: This activity is designed to help especially those students who have not taken Physics 093 or 101/111 remember some graphing skills and learn some new ones. It should be treated as a regular lab report; so prelab is required.. You are strongly advised to review section F (page 14) on plotting a graph and Appendix A on analysis of a linear graph. The easiest graphs to analyze are linear ("straight-line") graphs - sadly, most experimental relationships in physics are not that simple. This activity will show you how to analyze a power equation using logarithmic graphs. Objective: The purpose of this activity is to find mathematical relationship between the number of heartbeats per minute (B) for a mammal and the body mass (M) of that mammal. Theory: Logarithmic Graphical Analysis Although most graphs or plots use axes that have linear scales, logarithmic scales are also used in physics for two main reasons. The first is when the data stretches over many powers of 10. On a log scale, values covering a range of 1 to 10,000 can be plotted and be distributed uniformly, but on a linear scale, all values below 1000 would be crammed into the first 1/10 of the range. Ln-In (or log-log) plots are therefore generally used when the data range is very large - i.e., it covers several orders of magnitude. The second reason for the use of logarithmic graphs is that it can help in the analysis of power graphs (i.e. z = kw") examples of which are shown in Figure Al.1. If the data which results in a power or an inverse graph is made into a In-In graph, the line becomes straight with the slope of the line equal to the exponent of the independent variable (this will be shown below). Because straight-line graphs are easy to analyze, In-In graphs are used extensively in physics, and many other disciplines. It is first assumed that the equation between two variables is a power formula, i.e.: z = kwh (A1.1) N z =kw", n = 0 z = kw", n > 1 K z =kw", 0
Step by Step Solution
There are 3 Steps involved in it

Get step-by-step solutions from verified subject matter experts