

Question: 16. Complete the trend analysis (percentage change) using the first chart as your basis. Dollars 1 Year Ago 2 Years Ago 3 Years Ago Current
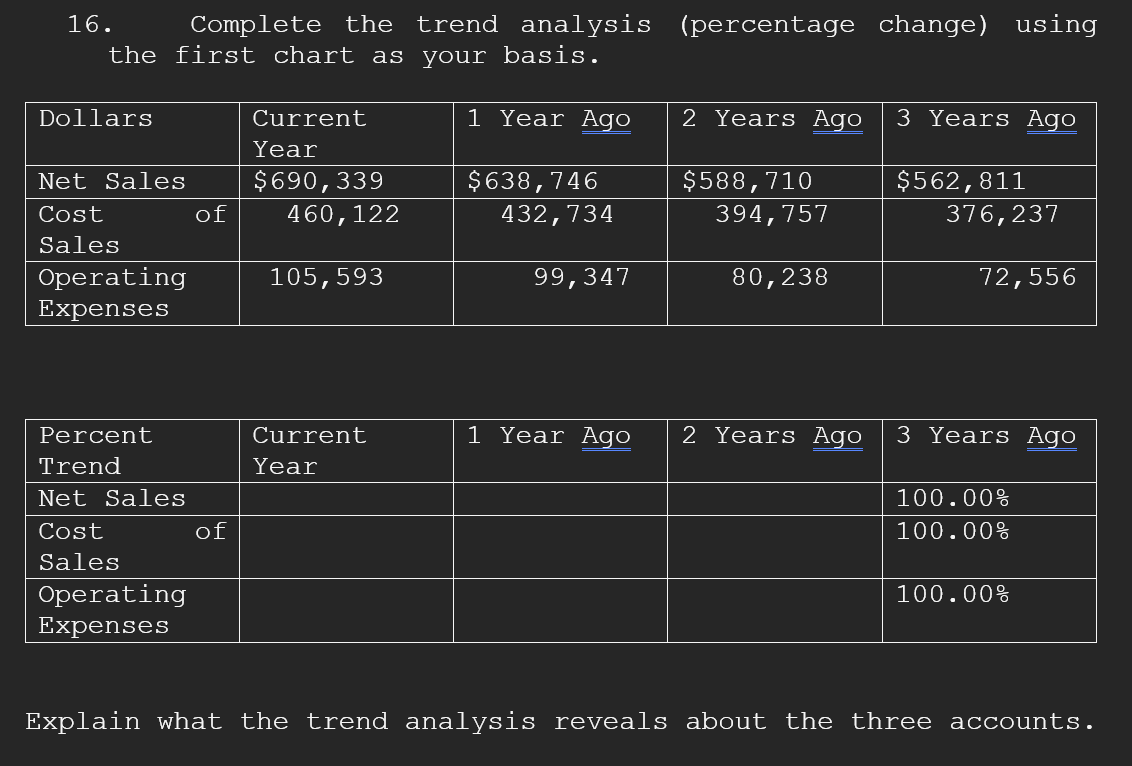
16. Complete the trend analysis (percentage change) using the first chart as your basis. Dollars 1 Year Ago 2 Years Ago 3 Years Ago Current Year $690,339 460,122 $638,746 432,734 $588,710 394,757 $562,811 376,237 Net Sales Cost of Sales Operating Expenses 105,593 99,347 80,238 72,556 1 Year Ago 2 Years Ago 3 Years Ago Current Year Percent Trend Net Sales Cost of Sales Operating Expenses 100.00% 100.00% 100.00% Explain what the trend analysis reveals about the three accounts
Step by Step Solution
There are 3 Steps involved in it
1 Expert Approved Answer
Step: 1 Unlock

Question Has Been Solved by an Expert!
Get step-by-step solutions from verified subject matter experts
Step: 2 Unlock
Step: 3 Unlock