

Question: /*16. Does the constant error variance assumption hold? Residuals vs Predicted Values The UNIVARIATE Procedure Variable: ToddlerWtGain Moments N 122 Sum Weights 122 Mean 16.6467213
/*16. Does the constant error variance assumption hold?
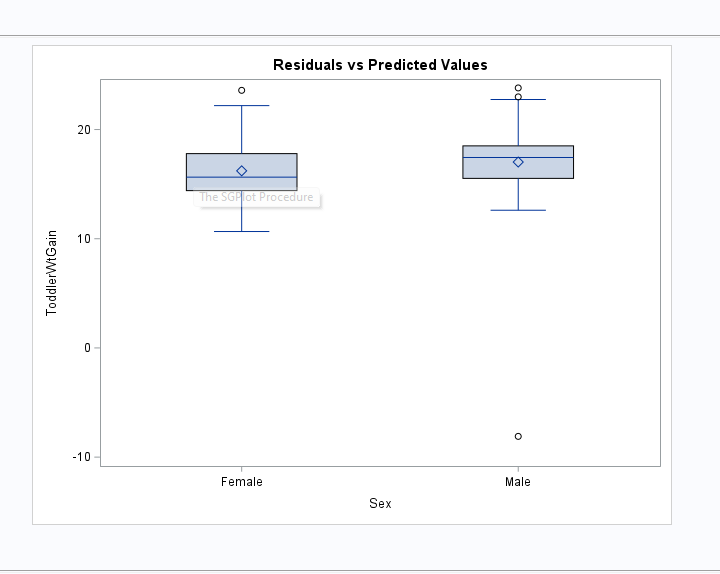
| Residuals vs Predicted Values |
The UNIVARIATE Procedure
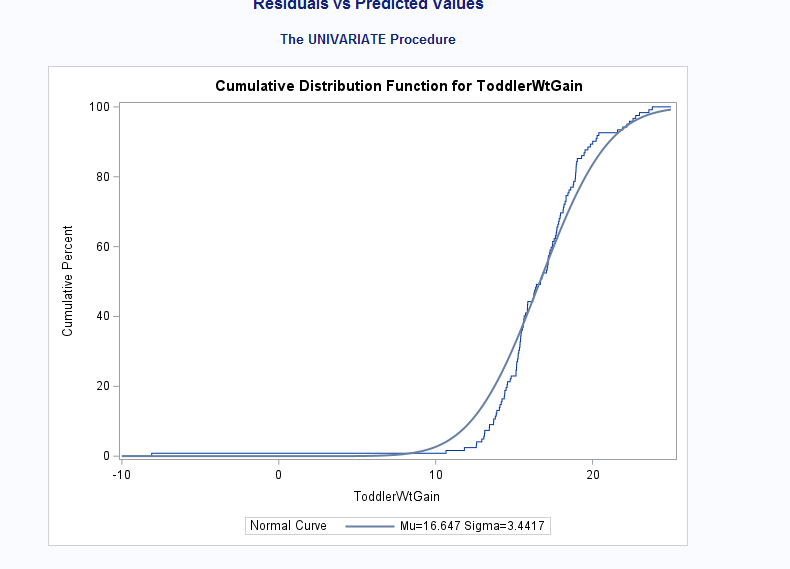
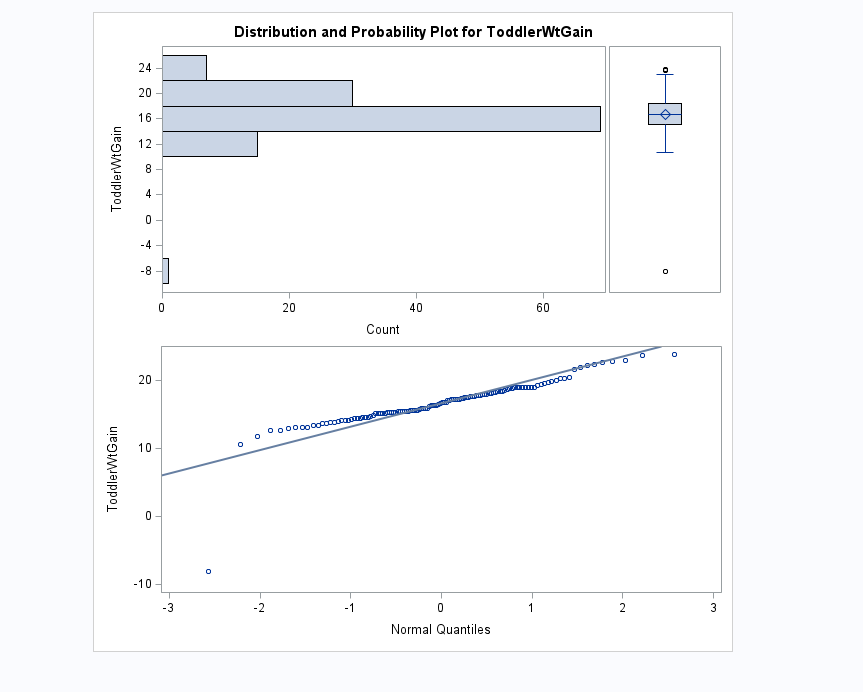
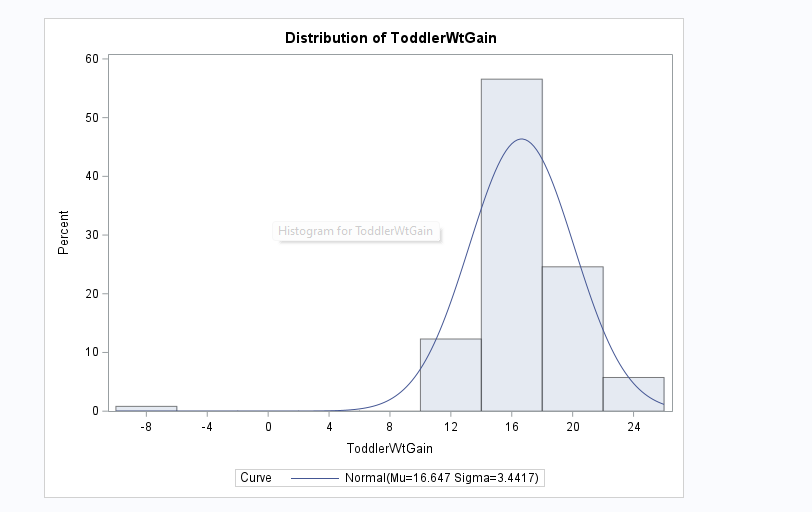
Variable: ToddlerWtGain
| Moments | |||
|---|---|---|---|
| N | 122 | Sum Weights | 122 |
| Mean | 16.6467213 | Sum Observations | 2030.9 |
| Std Deviation | 3.44170471 | Variance | 11.8453313 |
| Skewness | -2.8159955 | Kurtosis | 21.247275 |
| Uncorrected SS | 35241.1114 | Corrected SS | 1433.28509 |
| Coeff Variation | 20.6749704 | Std Error Mean | 0.3115973 |
| Basic Statistical Measures | |||
|---|---|---|---|
| Location | Variability | ||
| Mean | 16.64672 | Std Deviation | 3.44170 |
| Median | 16.68500 | Variance | 11.84533 |
| Mode | 15.12000 | Range | 31.91000 |
| Interquartile Range | 3.28000 |
| Note: The mode displayed is the smallest of 4 modes with a count of 2. |
| TestsforLocation:Mu0=0 | ||||
|---|---|---|---|---|
| Test | Statistic | p Value | ||
| Student's t | t | 53.42383 | Pr > |t| | <.0001> |
| Sign | M | 60 | Pr >= |M| | <.0001> |
| Signed Rank | S | 3750.5 | Pr >= |S| | <.0001> |
| Quantiles(Definition5) | |
|---|---|
| Level | Quantile |
| 100% Max | 23.810 |
| 99% | 23.590 |
| 95% | 22.190 |
| 90% | 20.010 |
| 75% Q3 | 18.430 |
| 50% Median | 16.685 |
| 25% Q1 | 15.150 |
| 10% | 13.700 |
| 5% | 13.070 |
| 1% | 10.660 |
| 0% Min | -8.100 |
| Extreme Observations | |||
|---|---|---|---|
| Lowest | Highest | ||
| Value | Obs | Value | Obs |
| -8.10 | 102 | 22.58 | 85 |
| 10.66 | 11 | 22.75 | 26 |
| 11.83 | 87 | 22.99 | 59 |
| 12.59 | 65 | 23.59 | 60 |
| 12.61 | 99 | 23.81 | 112 |
| Missing Values | |||
|---|---|---|---|
| Missing Value | Count | Percent Of | |
| All Obs | Missing Obs | ||
| . | 19 | 13.48 | 100.00 |
| Residuals vs Predicted Values |
The UNIVARIATE Procedure
| Residuals vs Predicted Values |
The UNIVARIATE Procedure
Fitted Normal Distribution for ToddlerWtGain
| Parameters for Normal Distribution | ||
|---|---|---|
| Parameter | Symbol | Estimate |
| Mean | Mu | 16.64672 |
| Std Dev | Sigma | 3.441705 |
| Goodness-of-Fit Tests for Normal Distribution | ||||
|---|---|---|---|---|
| Test | Statistic | p Value | ||
| Kolmogorov-Smirnov | D | 0.10498252 | Pr > D | |
| Cramer-von Mises | W-Sq | 0.36108444 | Pr > W-Sq | |
| Anderson-Darling | A-Sq | 2.70319046 | Pr > A-Sq |
| Quantiles for Normal Distribution | ||
|---|---|---|
| Percent | Quantile | |
| Observed | Estimated | |
| 1.0 | 10.6600 | 8.64012 |
| 5.0 | 13.0700 | 10.98562 |
| 10.0 | 13.7000 | 12.23600 |
| 25.0 | 15.1500 | 14.32533 |
| 50.0 | 16.6850 | 16.64672 |
| 75.0 | 18.4300 | 18.96812 |
| 90.0 | 20.0100 | 21.05744 |
| 95.0 | 22.1900 | 22.30782 |
| 99.0 | 23.5900 | 24.65332 |
| Residuals vs Predicted Values |
The UNIVARIATE Procedure
| Residuals vs Predicted Values |
The UNIVARIATE Procedure
Variable: residual
| Missing Values | |||
|---|---|---|---|
| Missing Value | Count | Percent Of | |
| All Obs | Missing Obs | ||
| . | 2 | 100.00 | 100.00 |
\f\f\f\f
Step by Step Solution
There are 3 Steps involved in it
1 Expert Approved Answer
Step: 1 Unlock

Question Has Been Solved by an Expert!
Get step-by-step solutions from verified subject matter experts
Step: 2 Unlock
Step: 3 Unlock