

Question: 16 F Help for this spreadsheet 17 M Points Age Frequency Distribution: Class Width 5 18F Review 2.2, 3.1 - 3.3 of your text. Also

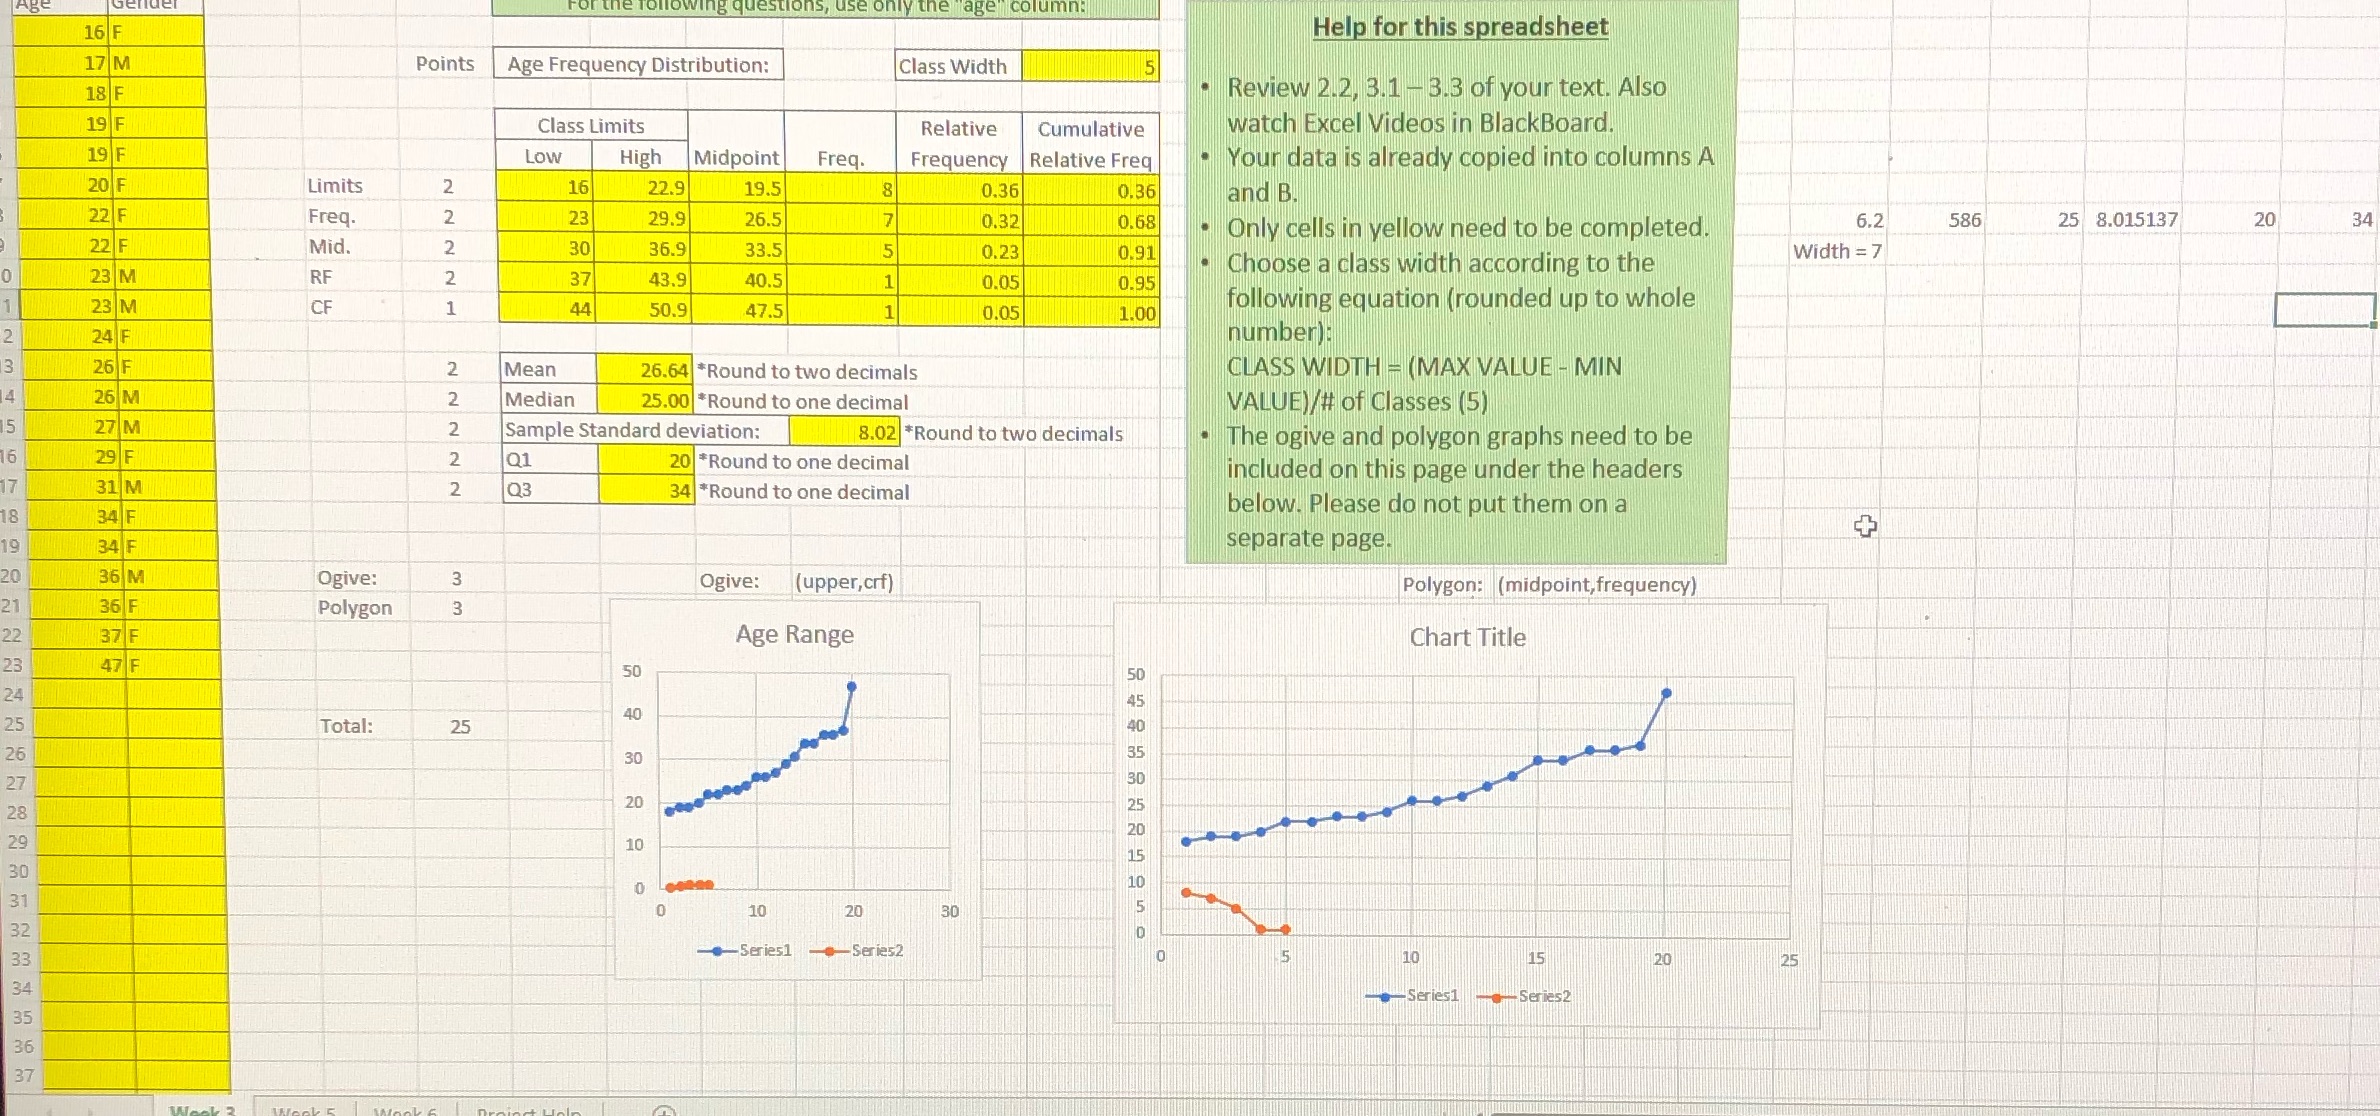
16 F Help for this spreadsheet 17 M Points Age Frequency Distribution: Class Width 5 18F Review 2.2, 3.1 - 3.3 of your text. Also 19 F Class Limits Relative Cumulative watch Excel Videos in BlackBoard. 19 F LOW High Midpoint Freq. Frequency Relative Freq Your data is already copied into columns A 20 F Limits 16 2.9 19.5 CO 0.36 0.36 and B. 22 F Freq. 23 29.9 26.5 0.32 0.68 Only cells in yellow need to be completed. 6.2 586 25 8.015137 20 34 22 F Mid. NN NN 30 36.9 33.5 0.23 0.91 Choose a class width according to the Width = 7 23 M RF 37 43.9 40.5 0.05 0.95 23 M CF 44 50.9 47.5 0.05 1.00 following equation (rounded up to whole 24 F number): A W N 26 F Mean 26.64 *Round to two decimals CLASS WIDTH - (MAX VALUE - MIN 26 M NN Median 25.00 *Round to one decimal VALUE)/# of Classes (5) Un 27 M 2 Sample Standard deviation: 8.02 *Round to two decimals . The ogive and polygon graphs need to be 29 F 2 Q1 20 #Round to one decimal included on this page under the headers 31 M 2 Q3 34 *Round to one decimal below. Please do not put them on a 10 00 4 34 F + 34 F separate page 20 36 M Ogive: Ogive: (upper, crf) Polygon: (midpoint,frequency) W W 21 36 F Polygon 22 37 F Age Range Chart Title 23 47 F 50 50 24 40 25 Total: 25 26 30 27 20 28 29 10 30 10 120 30 Series1 Series2 O 15 10 15 20 25 Series1 Series2
Step by Step Solution
There are 3 Steps involved in it

Get step-by-step solutions from verified subject matter experts