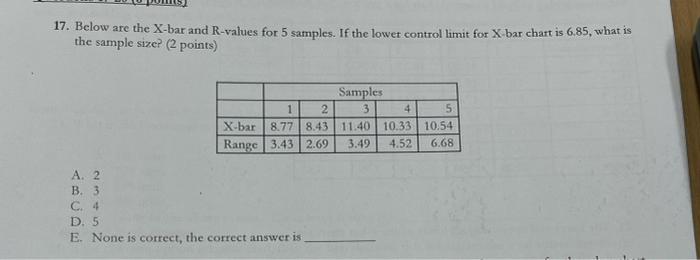
Question: 17. Below are the X-bar and R-values for 5 samples. If the lower controllimit for X bar chart is 6.85, what is the sample size?

17. Below are the X-bar and R-values for 5
17. Below are the X-bar and R-values for 5 samples. If the lower controllimit for X bar chart is 6.85, what is the sample size? (2 points) Samples 1 2 3 4 5 X-bar 8.778.43 11.40 10.33 10.54 Range 3.432.69 3.49 4.52 6.68 A 2 B. 3 C. 4 D. 5 E. None is correct, the correct answer is

Step by Step Solution

There are 3 Steps involved in it

1 Expert Approved Answer
Step: 1 Unlock blur-text-image
Question Has Been Solved by an Expert!

Get step-by-step solutions from verified subject matter experts

Step: 2 Unlock
Step: 3 Unlock

Students Have Also Explored These Related General Management Questions!