

Question: *17. Consider the financial statement data and stock price data for Mydeco Corp. Suppose Mydeco repurchases 2.2 million shares each year from 2015 to 2018.
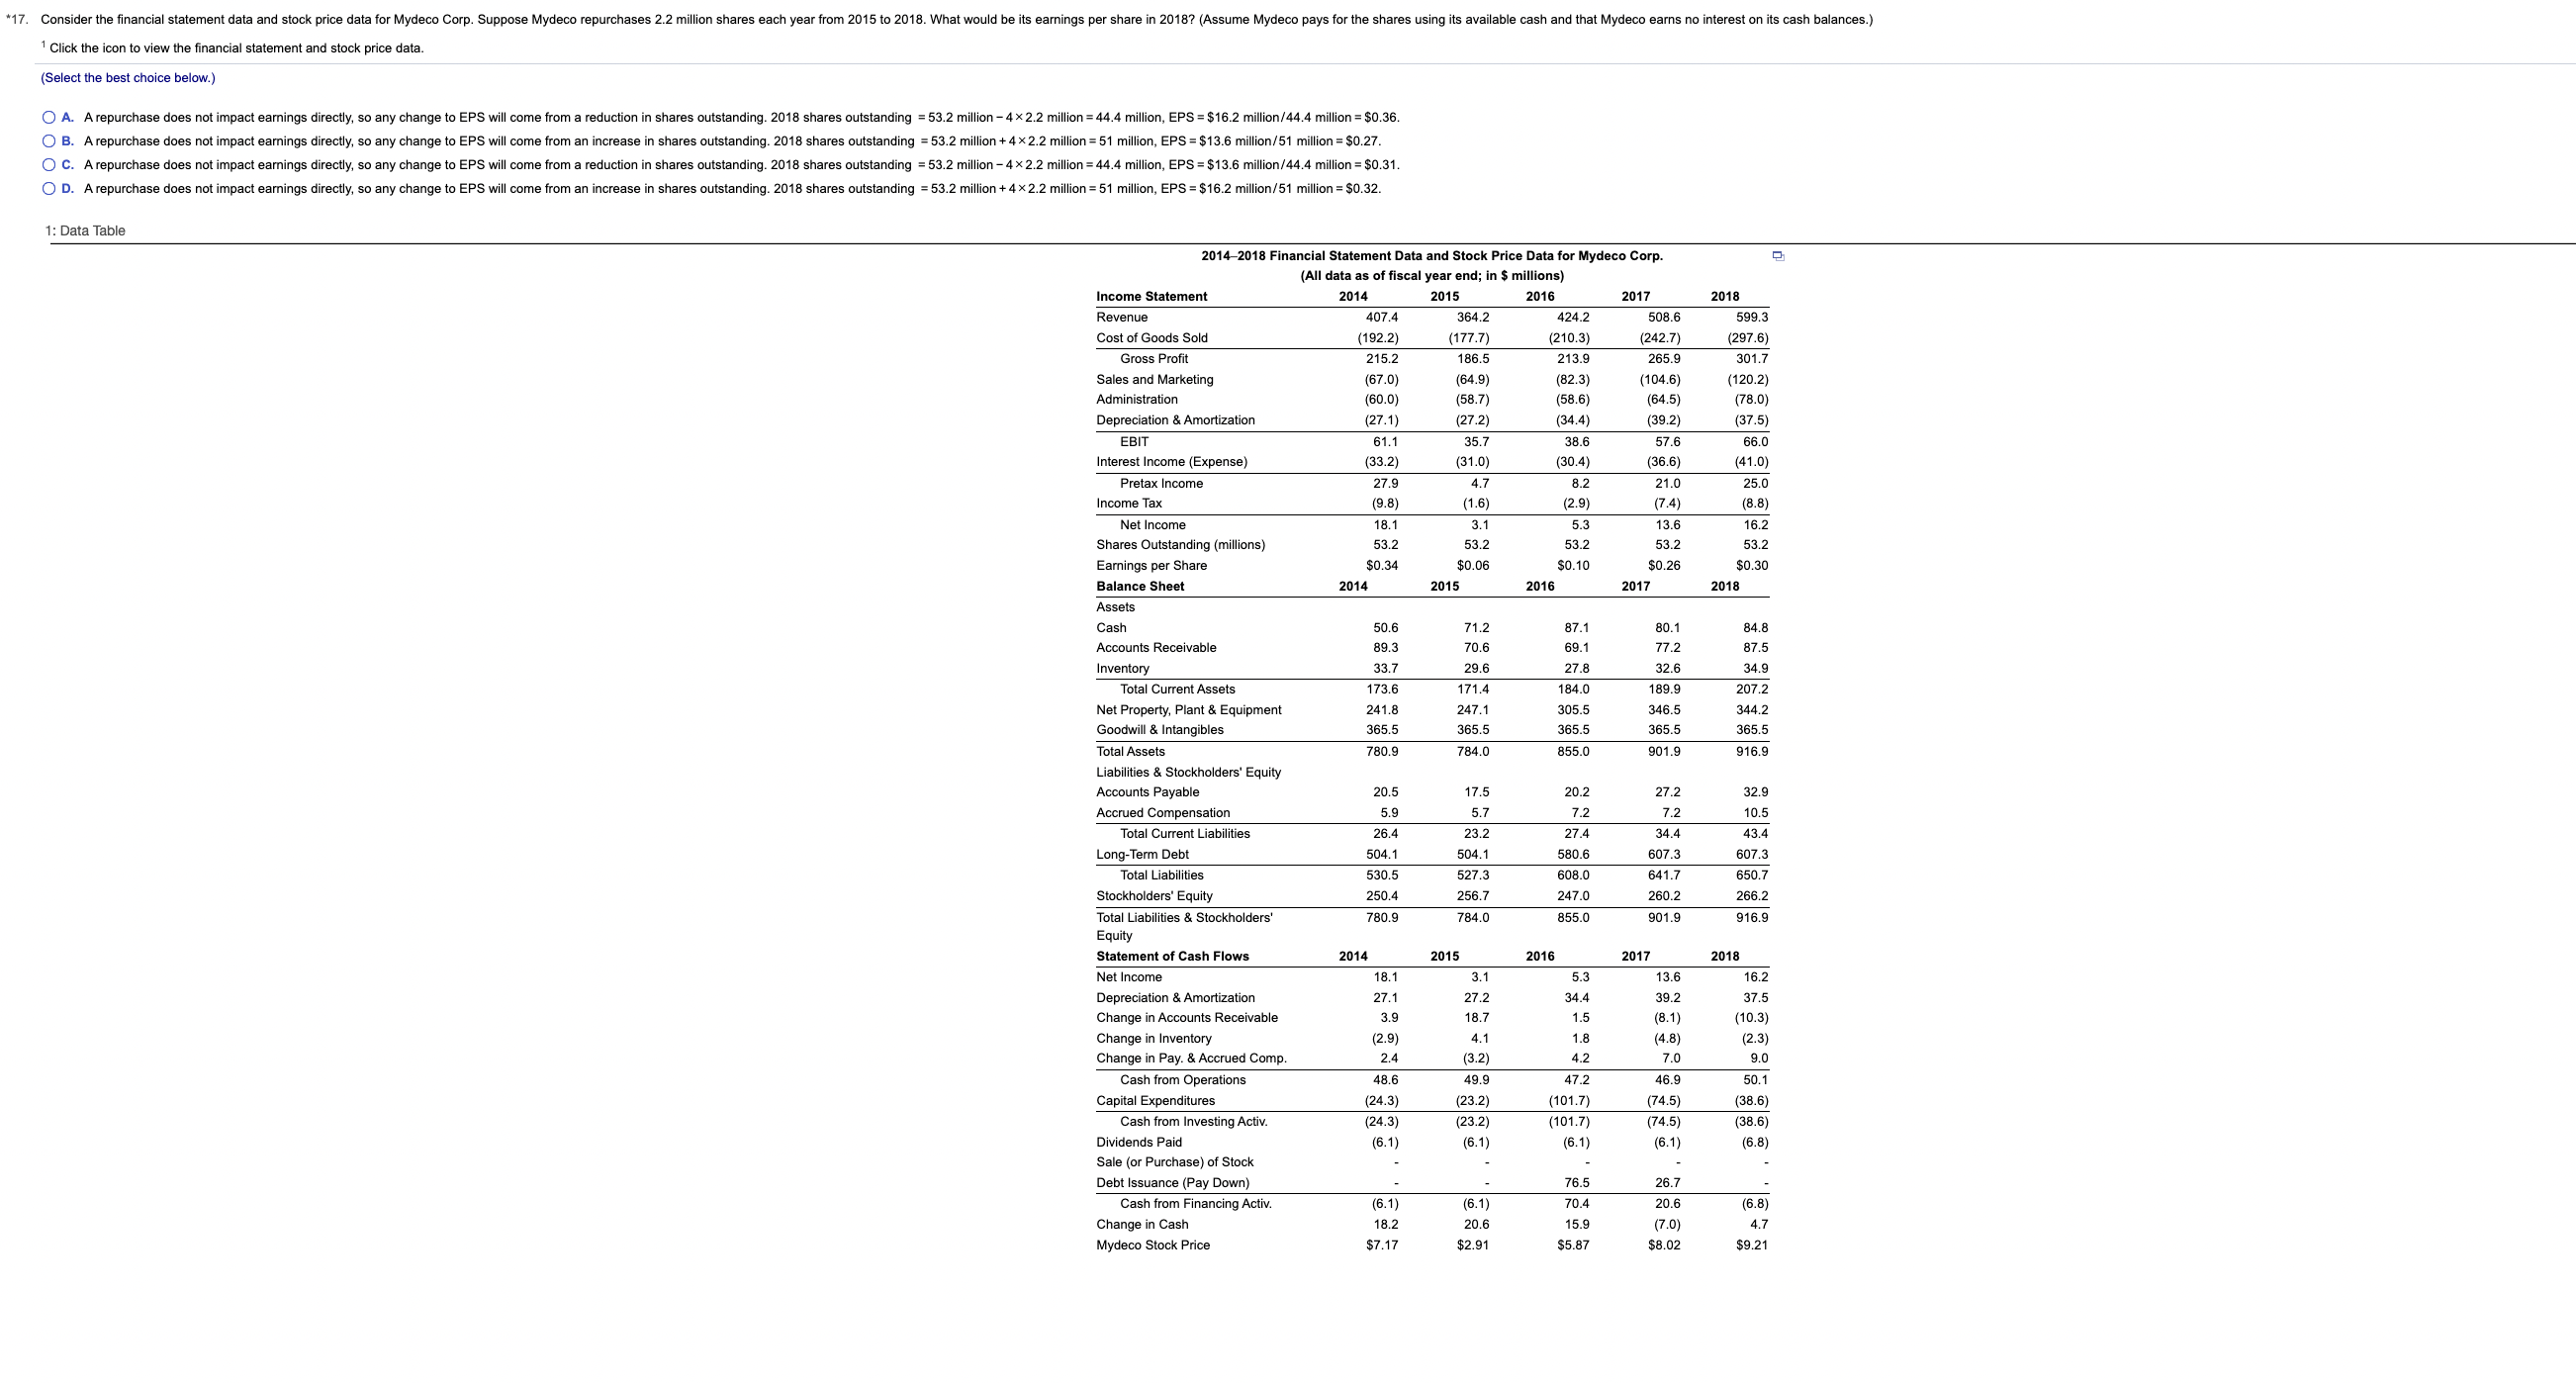
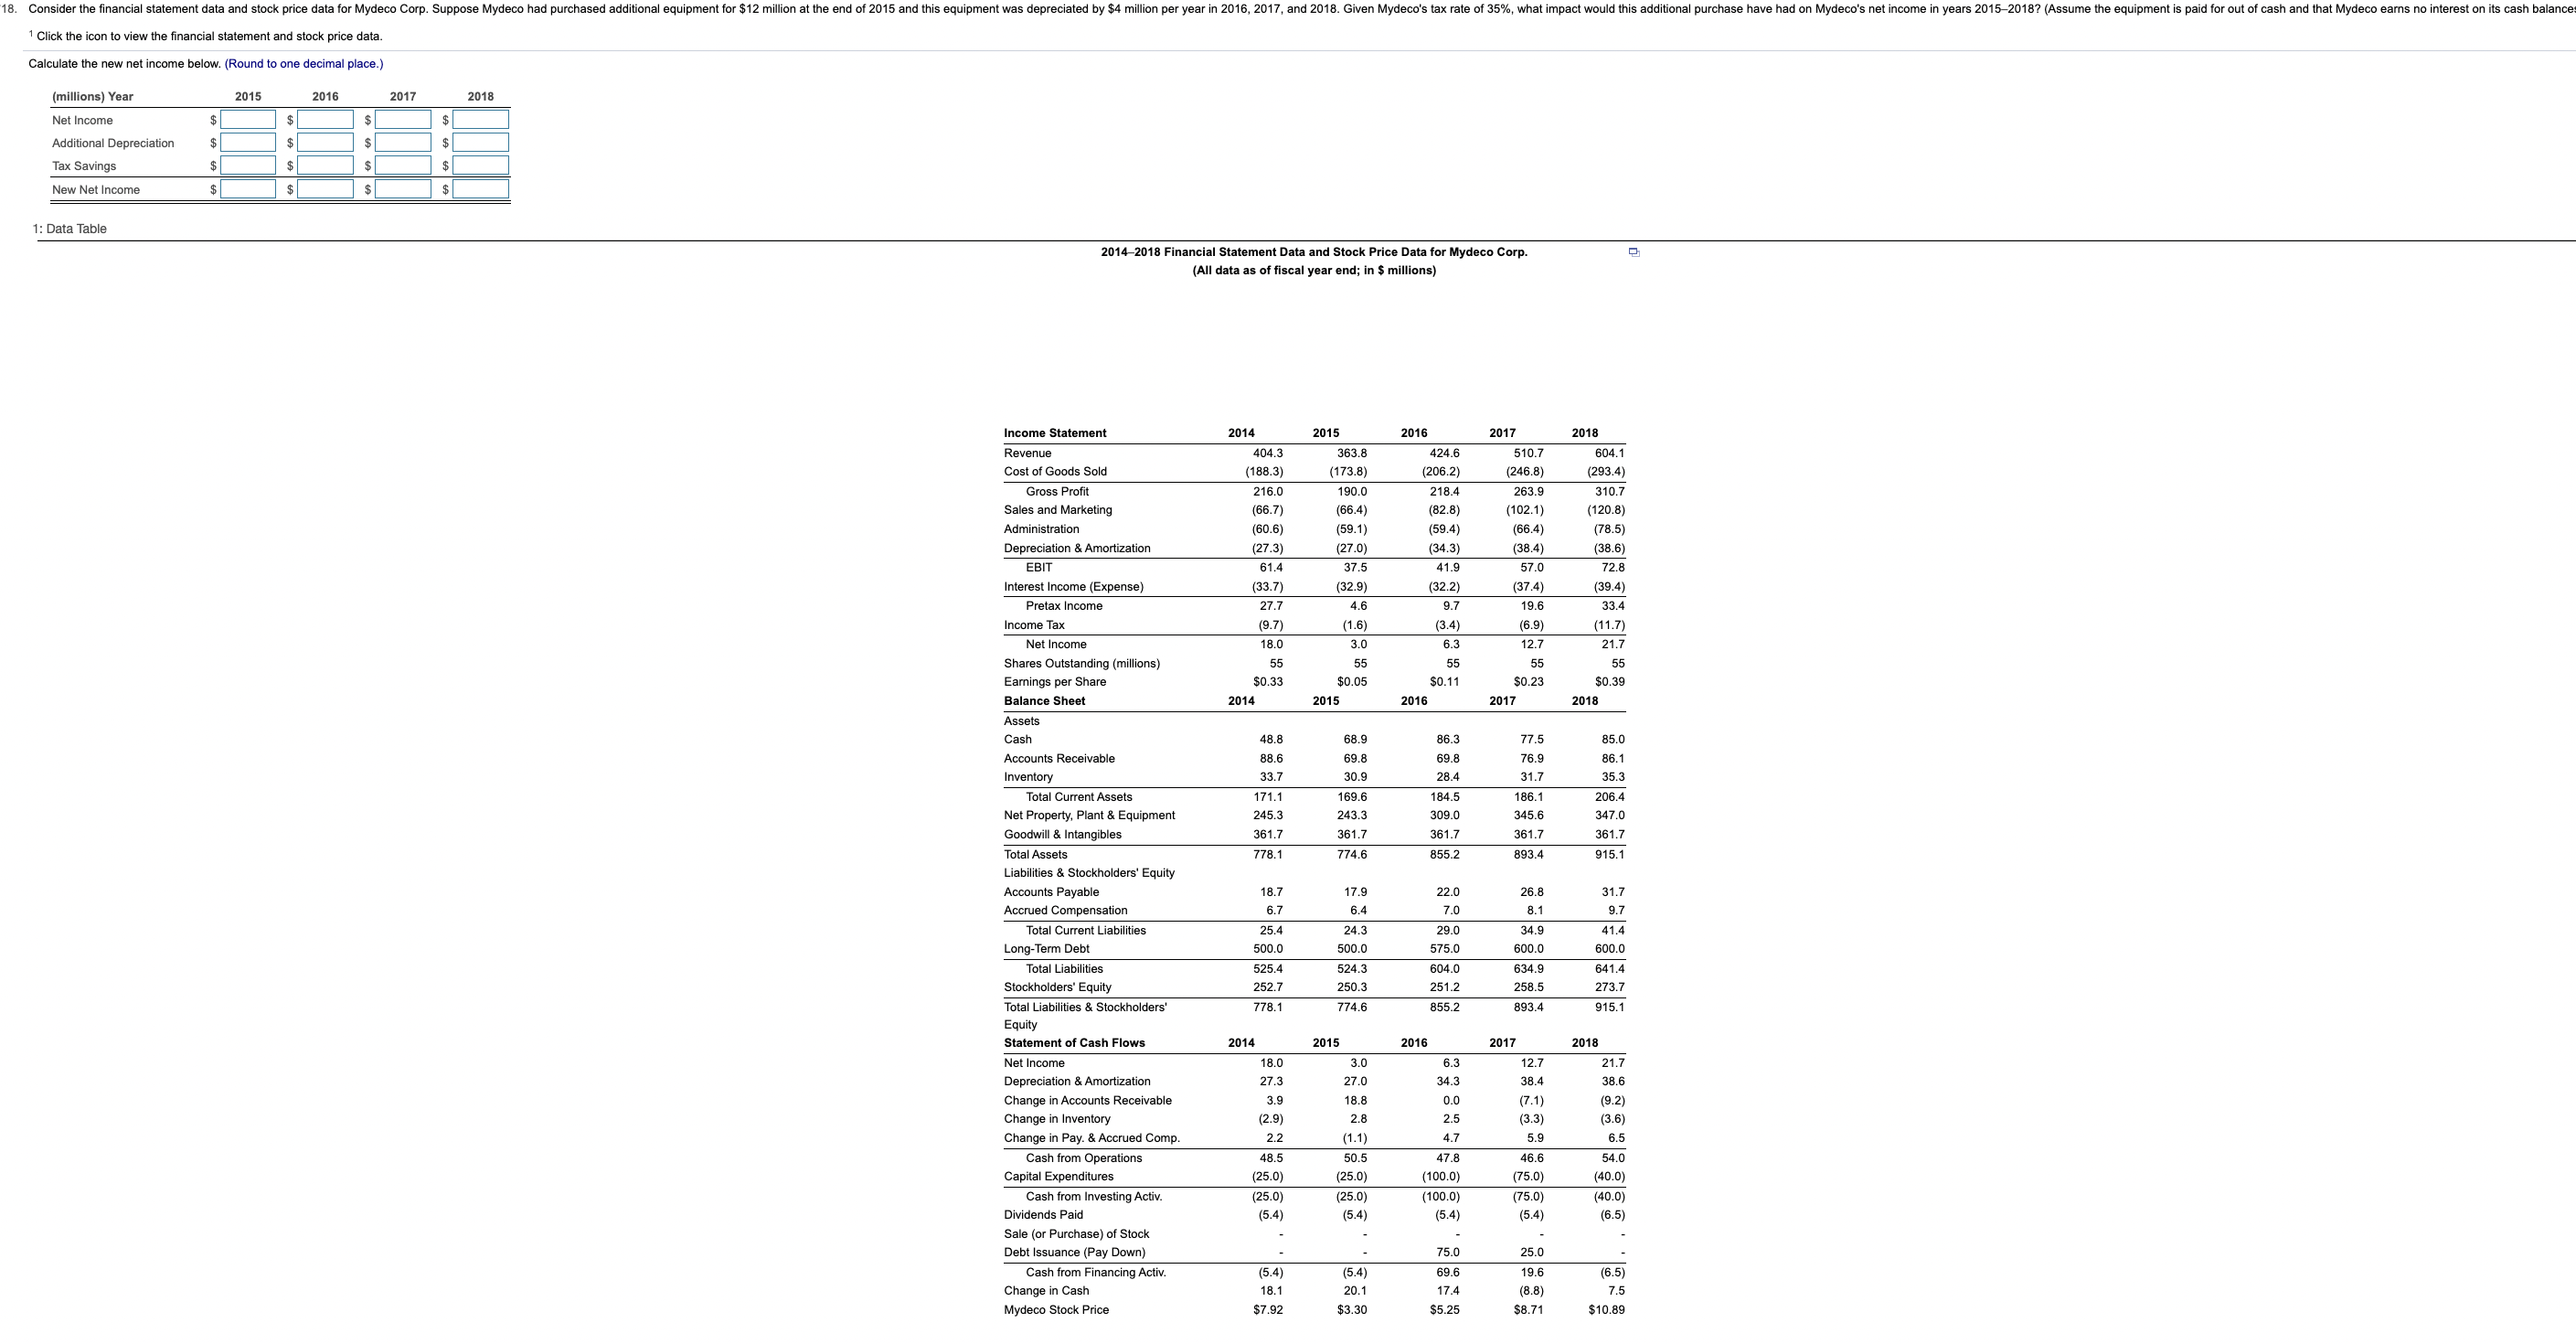
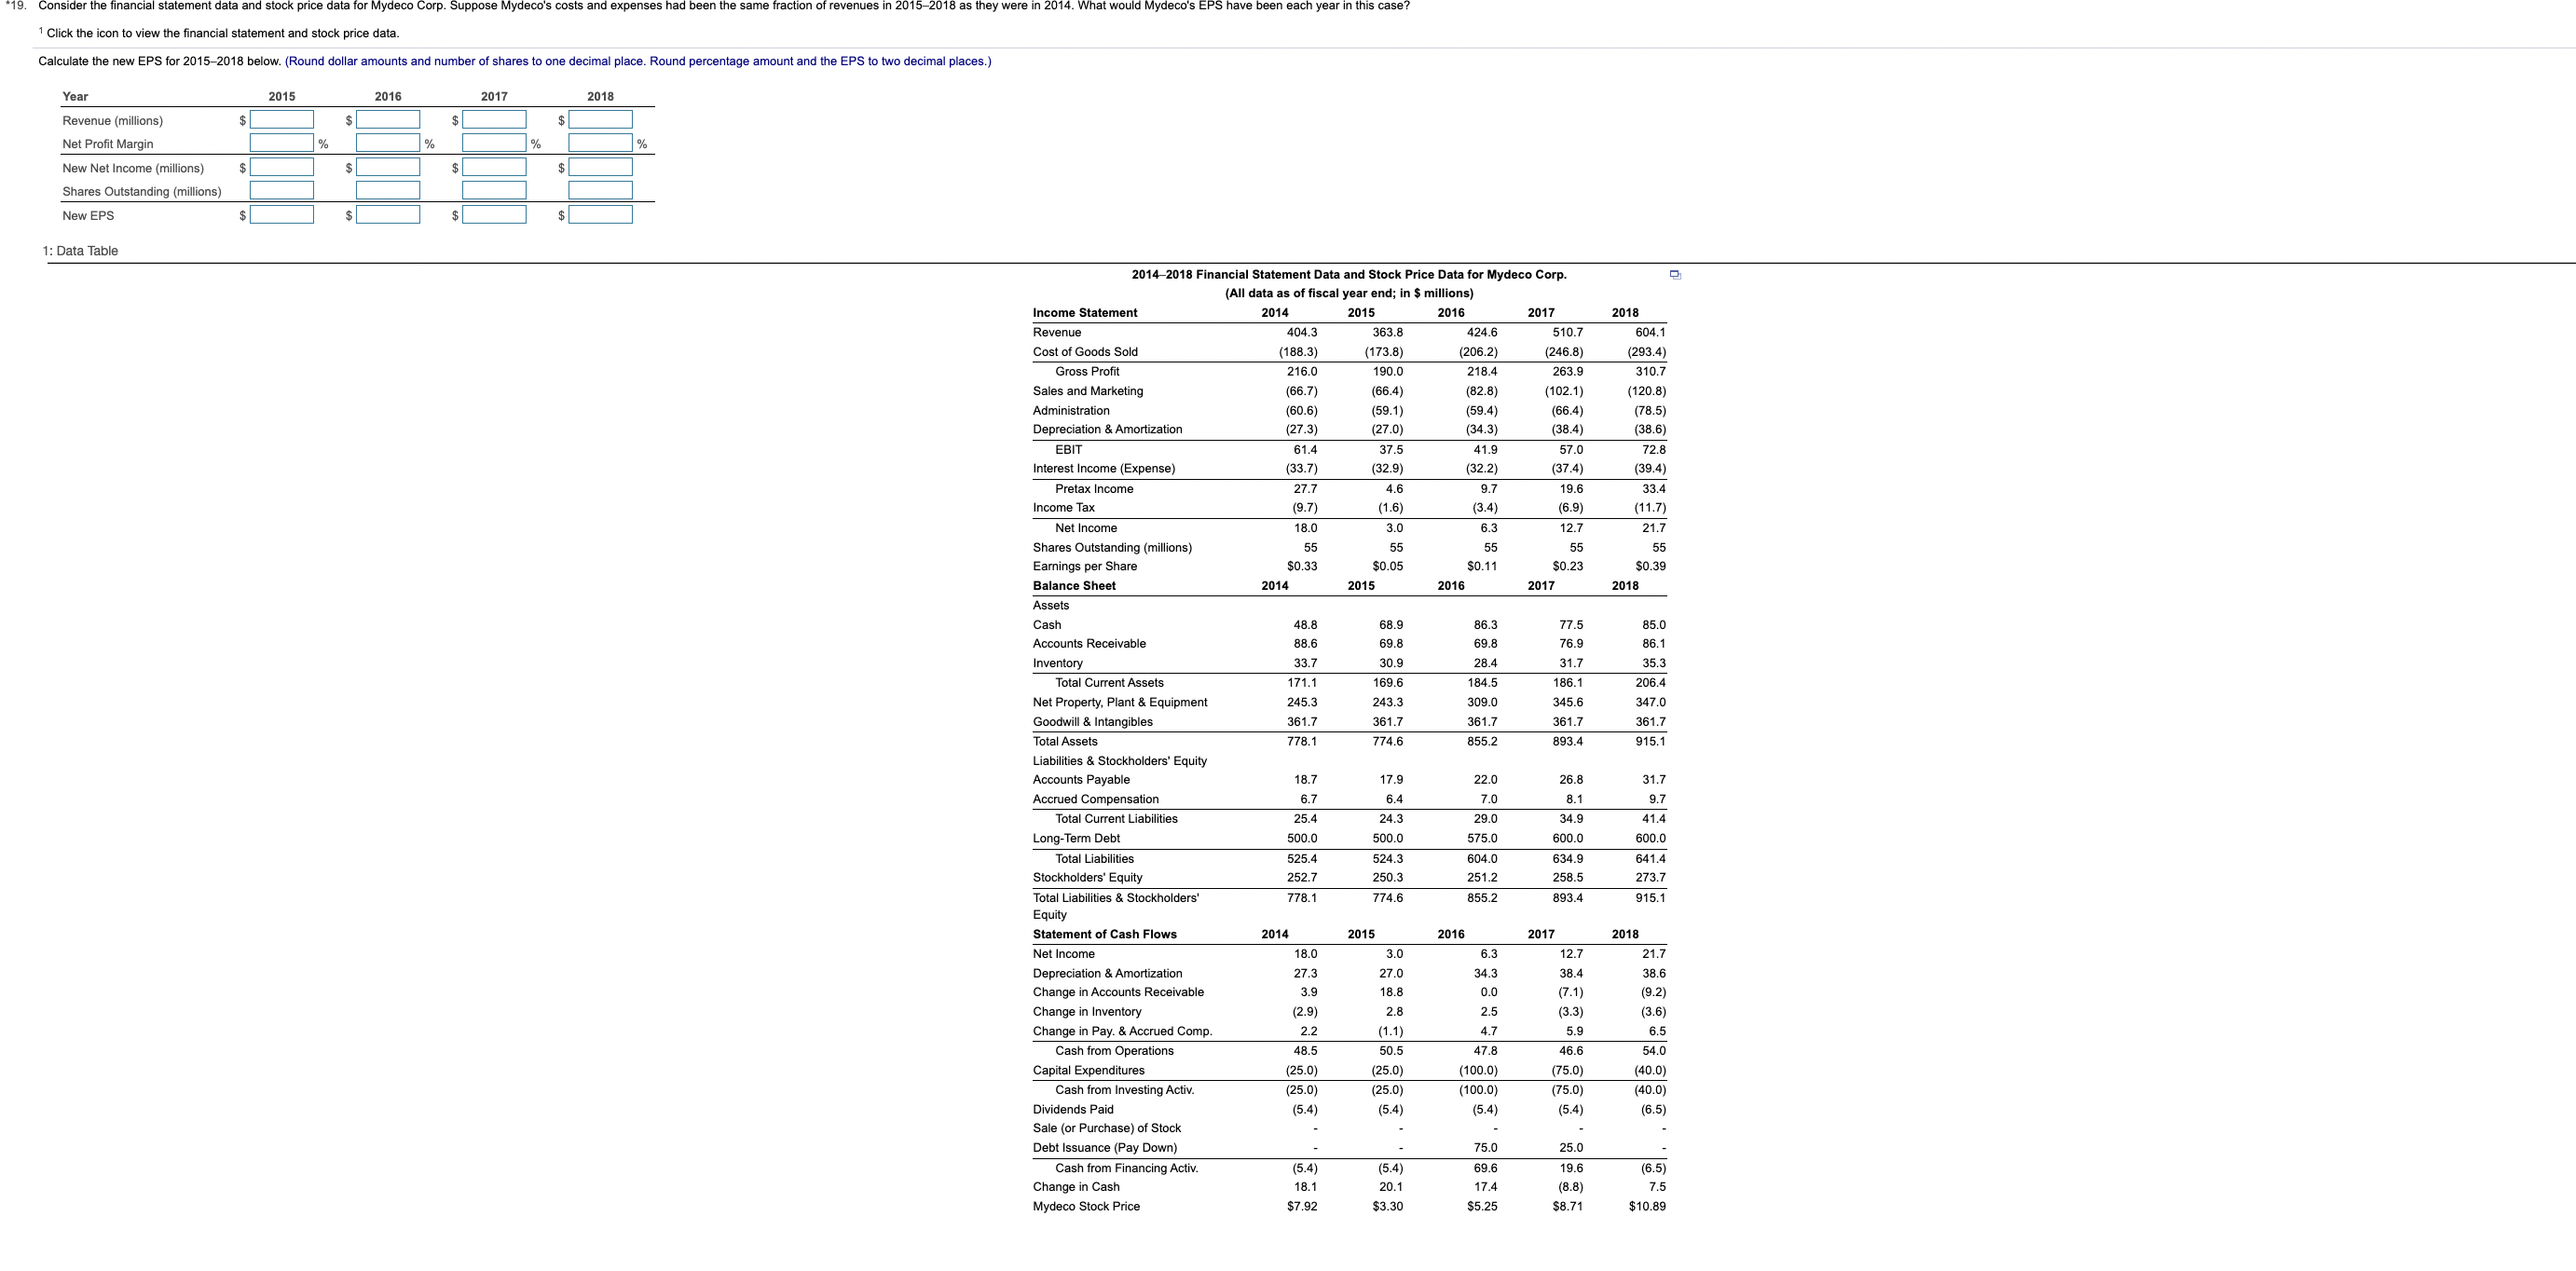
*17. Consider the financial statement data and stock price data for Mydeco Corp. Suppose Mydeco repurchases 2.2 million shares each year from 2015 to 2018. What would be its earnings per share in 2018? (Assume Mydeco pays for the shares using its available cash and that Mydeco earns no interest on its cash balances.) 1 Click the icon to view the financial statement and stock price data. (Select the best choice below.) O A. A repurchase does not impact earnings directly, so any change to EPS will come from a reduction in shares outstanding. 2018 shares outstanding = 53.2 million - 4 x 2.2 million = 44.4 million, EPS = $16.2 million/44.4 million = $0.36. landing = 53.2 million + 4 x 2.2 million = 51 million, EPS = $13.6 million/51 million = $0.27 O B. A repurchase d earnings directly, so any change to EPS will come from an O C. A repurchase does not impact earnings directly, so any change to EPS will come from a reduction in shares outstanding. 2018 shares outstanding = 53.2 million - 4 x 2.2 million = 44.4 million, EPS = $13.6 million/44.4 million = $0.31. O D. A repurchase does not impact earnings directly, so any change to EPS will come from an incre hares outstanding = 53.2 million + 4 x 2.2 million = 51 million, EPS = $16.2 million/51 million = $0.32. 1: Data Table 2014-2018 Financial Statement Data and Stock Price Data for Mydeco Corp. (All data as of fiscal year end; in $ millions Income Statement 2014 2015 2016 2017 2018 Revenue 407 364. 424 508.6 599.3 Cost of Goods Sold 192.2 177.7 (210.3) 242.7 297.6 Gross Profit 215.2 186.5 213.9 265.9 301.7 Sales and Marketing (67.0 64.9 (82.3) (104.6) (120.2) Administration (60.0 (58.7) 58.6) (64.5) (78.0) 37.5) Depreciation & Amortization (27.1) (27.2) 34.4) 39.2) EBIT 61.1 35,7 38.6 57.6 66.0 nterest Income (Expense) (33.2) 31.0) (30.4) (36.6) 41.0) Pretax Income 27.9 4.7 8.2 21 . 25.0 Income Tax (9.8) 1.6) 2.9) (7.4 (8.8) 18.1 3.1 53 13.6 16.2 Net Income Shares Outstanding (millions) 53.2 53.2 53.2 53.2 53.2 Earnings per Share $0.34 $0.06 $0.10 $0.26 $0.30 Balance Sheet 2014 2015 2016 2017 2018 Assets Cash 50.6 71.2 87.1 80.1 84.8 Accounts Receivable 89.3 70.6 69.1 77.2 87.5 33.7 29.6 27.8 32.6 34.9 Inventory Total Current Assets 173.6 171.4 184.0 189.9 207.2 241.8 247.1 305.5 344.2 Net Property, Plant & Equipment 346.5 Goodwill & Intangibles 365.5 365.5 365.5 365.5 365.5 916.9 Total Assets 780.9 784.0 855.0 901.9 Liabilities & Stockholders' Equity Accounts Payable 20.5 17.5 20.2 27.2 32.9 Accrued Compensation 5.9 5.7 7.2 10.5 Total Current Liabilities 26.4 23.2 27.4 34.4 43.4 Long-Term Debt 504.1 504.1 580.6 07.3 507.3 Total Liabilities 530. 527.3 $08.0 541.7 $50.7 Stockholders' Equity 250.4 256.7 247.0 260.2 266.2 Total Liabilities & Stockholders' 780.9 784.0 855.0 901.9 16.9 Equity 2014 2017 2018 Statement of Cash Flows 2015 2016 13.6 16.2 Net Income 18. 3.1 5.3 27.1 27.2 34.4 39.2 37.5 Depreciation & Amortization Change in Accounts Receivable 3.9 18.7 1.5 (8.1) 10.3) (2.3) Change in Inventory 2.9) 4.1 1.8 (4.8) 2.4 (3.2) 4.2 7.0 Change in Pay. & Accrued Comp. Cash from Operations 48.6 49.9 47.2 46.9 50 1 Capital Expenditures (24.3) 23.2 (101.7) (4.5) 38.6) Cash from Investing Activ. (24.3) 23.2) 101.7) 74.5) 38.6) Dividends Paid (6.1) (6.1) (6.1) (6.1) (6.8) Sale (or Purchase) of Stock Debt Issuance (Pay Down) 76.5 26.7 Cash from Financing Activ. (6.1) (6.1) 70.4 20.6 6.8) Change in Cash 18.2 20.6 15.9 (7.0 ) Mydeco Stock Price $7.17 $2.91 $5.87 $8.02 $9.21ta for Mydeco Corp. Suppose M Click the icon to view the fin and stock price data Calculate the new net income below. (Round to one decimal place.) (millions) Year 2015 2016 2017 2018 Net Income Additional Depreciation Tax Savings New Net Income 1: Data Table 2014-2018 Financial Statement Data and Stock Price Data for Mydeco Corp. (All data as of fiscal year end; in $ millions) Income Statement 2014 2015 2016 2017 2018 Revenue 404.3 363. 424.6 510.7 604.1 Cost of Goods Sold (188.3) 173.8) (206.2) (246.8) 293.4) Gross Profit 216. 190. 218.4 263.9 310.7 Sales and Marketing (66.7) (66.4) 82.8 (102.1) 120.8) Administration (60.6) (59.1) (59.4) (66.4) (78.5) Depreciation & Amortization (27.3) (27.0) (34.3) (38.4) (38.6) EBIT 61.4 37.5 41.9 57.0 72.8 Interest Income (Expense) 33.7) 32.9) 32.2) 37.4) 39.4) Pretax Income 27.7 4.6 97 19.6 33.4 Income Tax (9.7) (1.6) (3.4) (6.9) 11.7) Net Income 18.0 3.0 6.3 127 21.7 Shares Outstanding (millions) 55 55 55 65 55 Earnings per Share $0.33 $0.05 $0.11 $0.23 $0.39 Balance Sheet 2014 2015 2016 2017 2018 Assets Cash 48.8 68.9 86.3 77.5 85.0 Accounts Receivable 88.6 69.8 59.8 76.9 86.1 Inventory 33.7 30.9 28.4 31,7 35.3 Total Current Assets 171.1 169.6 184.5 186.1 206.4 Net Property, Plant & Equipment 245.3 243.3 309.0 345.6 347.0 Goodwill & Intangibles 361.7 361.7 361.7 361.7 361.7 Total Assets 778.1 774.6 855.2 893.4 915.1 Liabilities & Stockholders' Equity Accounts Payable 18.7 17.9 22.0 26.8 $1.7 Accrued Compensation 6.7 6.4 7.0 8 .1 9.7 Total Current Liabilities 25.4 24.3 29.0 34.9 41.4 Long-Term Debt 500.0 500.0 575.0 600.0 600.0 Total Liabilities 525.4 524.3 604.0 634.9 341.4 Stockholders' Equity 252.7 250.3 251.2 258.5 273.7 Total Liabilities & Stockholders' 778.1 774.6 855.2 893.4 915.1 Equity Statement of Cash Flows 2014 2015 2016 2017 2018 Net Income 18.0 3.0 6.3 12.7 21.7 Depreciation & Amortization 27.3 27.0 34.3 38.4 38.6 Change in Accounts Receivable 3.9 18.8 0.0 (7.1) (9.2) Change in Inventory 2.9) 2.8 2.5 3.3) (3.6) Change in Pay. & Accrued Comp 2.2 1.1) 4.7 5.9 6.5 Cash from Operations 48.5 50.5 47.8 46.6 54.0 Capital Expenditures (25.0) (25.0) 100.0) 75.0) (40.0) Cash from Investing Activ. 25.0) (25.0) (100.0) 75.0) 40.0) Dividends Paid (5.4) (5.4) (5.4) (5.4) (6.5) Sale (or Purchase) of Stock Debt Issuance (Pay Down) 75.0 25.0 Cash from Financing Activ. (5.4) (5.4) 69.6 19.6 6.5) Change in Cash 18.1 20.1 17.4 (8.8) 7.5 Mydeco Stock Price $7.92 $3.30 $5.25 $8.71 $10.891 Click the icon to view the financial statement and stock price data. Calculate the new EPS for 2015-2018 below. (Round dollar amounts and number of shares to one decimal place. Round percentage amount and the EPS to two decimal places.) Year 2015 2016 2017 2018 Revenue (millions) Net Profit Margin New Net Income (millions) Shares Outstanding (millions) New EPS 1: Data Table 2014-2018 Financial Statement Data and Stock Price Data for Mydeco Corp. (All data as of fiscal year end; in $ millions) Income Statement 2014 2015 2016 2017 2018 Revenue 404.3 363 .8 424 510.7 604 1 Cost of Goods Sold (188.3) (173.8) 206.2 (246.8) 293.4 Gross Profit 216.0 190.0 218.4 263.9 310.7 Sales and Marketing (66.7) (66.4) (82.8) (102.1) (120.8) Administration (60.6 (59.1) (59.4) (66.4) (78.5) Depreciation & Amortization (27.3) (27.0) (34.3) (38.4) (38.6) EBIT 61.4 37.5 41. 57. 72.8 Interest Income (Expense) 33.7) 32.9) 32.2) 37.4) 39.4) Pretax Income 27 7 4.6 9.7 19.6 33.4 Income Tax (9.7) 1.6) (3.4) (6.9) (11.7) 12.7 21,7 Net Income 18.0 3.0 6.3 Shares Outstanding (millions) 55 55 55 5 55 Earnings per Share $0.05 SO 11 $0.23 $0.3 Balance Sheet 2014 2015 2016 2017 2018 Assets Cash 48.8 68.9 86.3 77.5 85.0 Accounts Receivable 88.6 69.8 69.8 76.9 86.1 Inventory 33.7 30.9 28.4 31.7 35.3 Total Current Assets 171.1 169.6 184.5 186.1 206.4 Net Property, Plant & Equipment 245.3 243.3 309.0 345.6 347.0 Goodwill & Intangibles 361.7 361.7 361.7 361.7 361.7 Total Assets 778.1 774.6 855.2 893.4 915.1 Liabilities & Stockholders' Equity Accounts Payable 18.7 17.9 22.0 26.8 31.7 9,7 Accrued Compensation 6.7 6.4 7.0 8.1 Total Current Liabilities 25.4 24.3 29.0 34.9 41.4 Long-Term Debt 500.0 500.0 575.0 600.0 600.0 Total Liabilities 525.4 524.3 604. 634.9 341.4 Stockholders' Equity 252.7 250.3 251.2 258.5 273.7 Total Liabilities & Stockholders' 778.1 774.6 855.2 893.4 915.1 Equity Statement of Cash Flows 2014 2015 2016 2017 2018 Net Income 18.0 3.0 6.3 12. 21.7 Depreciation & Amortization 27.3 27.0 34.3 38. 38.6 Change in Accounts Receivable 3.9 18.8 0.0 (7.1) (9.2) Change in Inventory 2.9) 2.8 2.5 3.3) 3.6) 6.5 Change in Pay. & Accrued Comp 2.2 1.1) 4.7 5.9 Cash from Operations 48.5 50.5 47.8 46. 54.0 Capital Expenditures (25.0 25.0) 100.0 (75.0) (40.0) Cash from Investing Activ. (25.0 (25.0) (100.0) (75.0) (40.0) Dividends Paid (5.4) (5.4) (5.4) (5.4) (6.5) Sale (or Purchase) of Stock Debt Issuance (Pay Down) 75.0 25.0 Cash from Financing Activ. (5.4) (5.4) 69.6 19.6 6.5) Change in Cash 18.1 20.1 17.4 (8.8) Mydeco Stock Price $7.92 $3.30 $5.25 $8.71 $10.89
Step by Step Solution
There are 3 Steps involved in it

Get step-by-step solutions from verified subject matter experts