

Question: Consider the financial statement data and stock price data for Mydeco Corp. Suppose Mydeco repurchases 2.4 million shares each year from 2015 to 2018. What
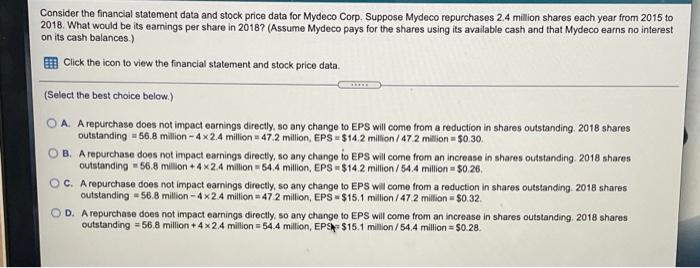
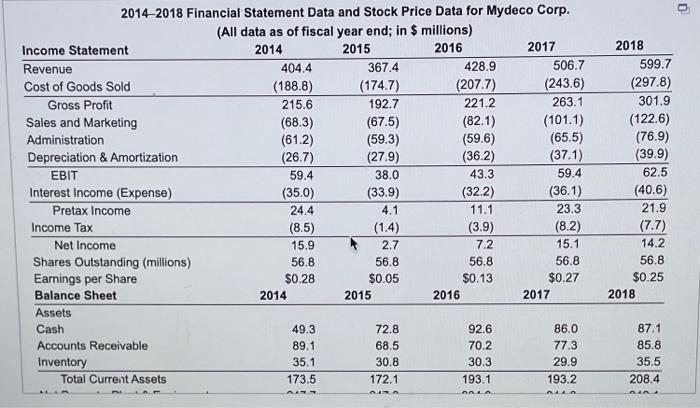
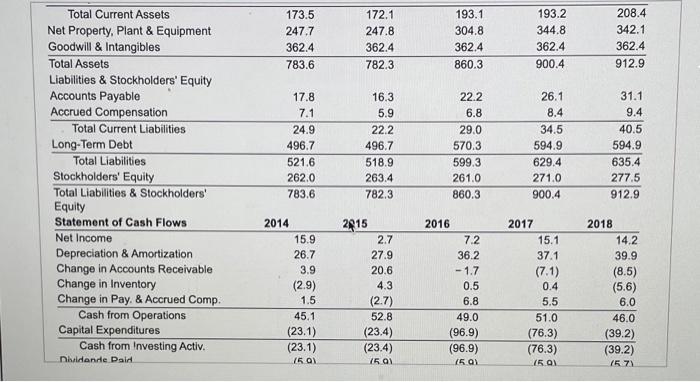
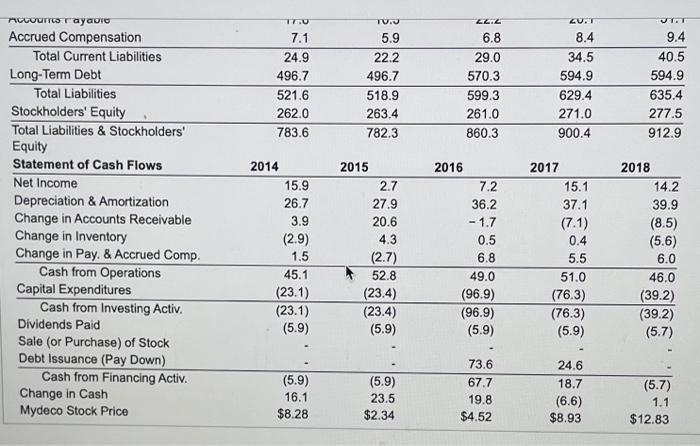
Consider the financial statement data and stock price data for Mydeco Corp. Suppose Mydeco repurchases 2.4 million shares each year from 2015 to 2018. What would be its earnings per share in 2018? (Assume Mydeco pays for the shares using its available cash and that Mydeco earns no interest on its cash balances.) Click the icon to view the financial statement and stock price data (Select the best choice below) A. A repurchase does not impact earnings directly, so any change to EPS will come from a reduction in shares outstanding. 2018 shares outstanding 56.8 million - 4x 2.4 million 47.2 million, EPS - $14.2 million/47.2 million $0.30 B. A repurchase does not impact earnings directly, so any change to EPS will come from an increase in shares outstanding 2018 shares outstanding - 56.8 million + 4 2.4 million - 54.4 million, EPS$14.2 million/54.4 million = 50.26. OC. A repurchase does not impact earnings directly, so any change to EPS will come from a reduction in shares outstanding 2018 shares outstanding - 56.8 million - 4x 2.4 million 47 2 million, EPS-$15.1 million/47 2 million $0.32 OD. A repurchase doen not impact earnings directly, so any change to EPS will come from an increase in shares outstanding 2018 shares outstanding - 56.8 million + 4x24 million = 54.4 million, EPS-$15.1 million/54,4 million=$0.28. o 2018 2014-2018 Financial Statement Data and Stock Price Data for Mydeco Corp. (All data as of fiscal year end; in $ millions) Income Statement 2014 2015 2016 2017 Revenue 404.4 367.4 428.9 506.7 Cost of Goods Sold (188.8) (174.7) (2077) (243.6) Gross Profit 215.6 192.7 221.2 263.1 Sales and Marketing (68.3) (67.5) (82.1) (101.1) Administration (61.2) (59.3) (59.6) (65.5) Depreciation & Amortization (26.7) (27.9) (36.2) (37.1) EBIT 59.4 38.0 43.3 59.4 Interest Income (Expense) (35.0) (33.9) (32.2) (36.1) Pretax Income 24.4 4.1 11.1 23.3 Income Tax (8.5) (1.4) (3.9) (8.2) Net Income 15.9 2.7 7.2 15.1 Shares Outstanding (millions) 56.8 56.8 56.8 56.8 Earnings per Share $0.28 $0.05 $0.13 $0.27 Balance Sheet 2014 2015 2016 2017 Assets Cash 49.3 72.8 92.6 86.0 Accounts Receivable 89.1 68.5 70.2 77.3 Inventory 35.1 30.8 30.3 29.9 Total Current Assets 173.5 172.1 193.1 193.2 599.7 (297.8) 301.9 (122.6) (76.9) (39.9) 62.5 (40.6) 21.9 (7.7) 14.2 56.8 $0.25 2018 87.1 85.8 35.5 208.4 AS Anun n. 173.5 247.7 362.4 783.6 172.1 247.8 362.4 782.3 193.1 304.8 362.4 860.3 193.2 344.8 362.4 900.4 208.4 342.1 362.4 912.9 Total Current Assets Net Property, Plant & Equipment Goodwill & Intangibles Total Assets Liabilities & Stockholders' Equity Accounts Payable Accrued Compensation Total Current Liabilities Long-Term Debt Total Liabilities Stockholders' Equity Total Liabilities & Stockholders' Equity Statement of Cash Flows Net Income Depreciation & Amortization Change in Accounts Receivable Change in Inventory Change in Pay. & Accrued Comp. Cash from Operations Capital Expenditures Cash from Investing Activ. niidende Dald 17.8 7.1 24.9 496.7 521.6 262.0 783.6 16.3 5.9 22.2 496.7 518.9 263.4 782.3 22.2 6.8 29.0 570.3 599.3 261.0 860.3 26.1 8.4 34.5 594.9 629.4 271.0 900.4 31.1 9.4 40.5 594.9 635.4 277.5 912.9 2815 2014 15.9 26.7 3.9 (2.9) 1.5 45.1 (23.1) (23.1) 150 2.7 27.9 20.6 4.3 (2.7) 52.8 (23.4) (23.4) 15.01 2016 7.2 36.2 -1.7 0.5 6.8 49.0 (96.9) (96.9) (50) 2017 15.1 37.1 (7.1) 0.4 5.5 51.0 (76.3) (76.3) 15.01 2018 14.2 39.9 (8.5) (5.6) 6.0 46.0 (39.2) (39.2) 15 7 JET 7.1 24.9 496.7 521.6 262.0 783.6 5.9 22.2 496.7 518.9 263.4 782.3 2. 6.8 29.0 570.3 599.3 261.0 860.3 ZU.T 8.4 34.5 594.9 629.4 271.0 900.4 9.4 40.5 594.9 635.4 277.5 912.9 Accrued Compensation Total Current Liabilities Long-Term Debt Total Liabilities Stockholders' Equity Total Liabilities & Stockholders' Equity Statement of Cash Flows Net Income Depreciation & Amortization Change in Accounts Receivable Change in Inventory Change in Pay. & Accrued Comp. Cash from Operations Capital Expenditures Cash from Investing Activ. Dividends Paid Sale (or Purchase) of Stock Debt Issuance (Pay Down) Cash from Financing Activ. Change in Cash Mydeco Stock Price 2014 15.9 26.7 3.9 (2.9) 1.5 45.1 (23.1) (23.1) (5.9) 2015 2.7 27.9 20.6 4.3 (2.7) 52.8 (23.4) (23.4) (5.9) 2016 7.2 36.2 -1.7 0.5 6.8 49.0 (96.9) (96.9) (5.9) 2017 15.1 37.1 (7.1) 0.4 5.5 51.0 (76.3) (76.3) (5.9) 2018 14.2 39.9 (8.5) (5.6) 6.0 46.0 (39.2) (39.2) (5.7) (5.9) 16.1 $8.28 (5.9) 23.5 $2.34 73.6 67.7 19.8 $4.52 24.6 18.7 (6.6) $8.93 (5.7) 1.1 $12.83
Step by Step Solution
There are 3 Steps involved in it

Get step-by-step solutions from verified subject matter experts