

Question: 17. Draw a graph below showing a demand and supply curve for rented parking spaces in the city using the demand and supply schedules on

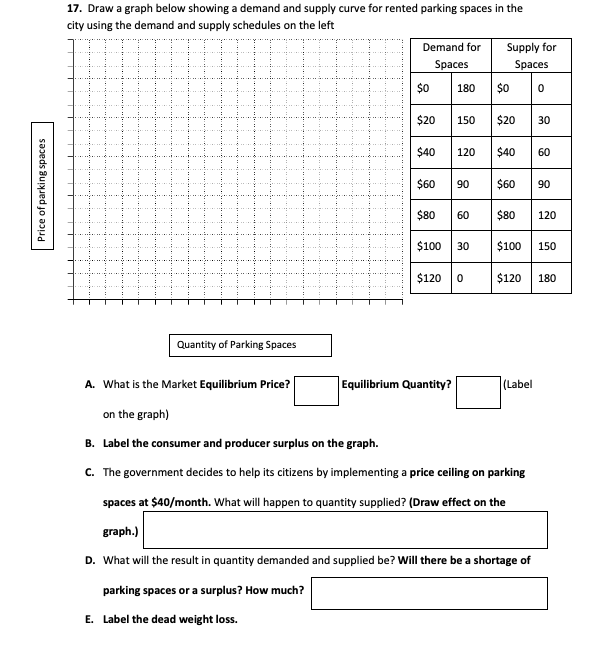
17. Draw a graph below showing a demand and supply curve for rented parking spaces in the city using the demand and supply schedules on the left Demand for Supply for Spaces Spaces SO 180 D ..... .... $20 150 $20 30 $40 120 $40 60 $60 90 $60 90 Price of parking spaces 180 60 $80 120 $100 30 $100 150 $120 5120 180 Quantity of Parking Spaces A. What is the Market Equilibrium Price? Equilibrium Quantity? Label on the graph) B. Label the consumer and producer surplus on the graph. C. The government decides to help its citizens by implementing a price ceiling on parking spaces at $40/month. What will happen to quantity supplied? (Draw effect on the graph.) D. What will the result in quantity demanded and supplied be? Will there be a shortage of parking spaces or a surplus? How much? E. Label the dead weight loss
Step by Step Solution
There are 3 Steps involved in it

Get step-by-step solutions from verified subject matter experts