

Question: d) & e) please Suppose that in the competitive market for widgets, the marginal cost function for a typical firm is given as MC(q) :
d) & e) please
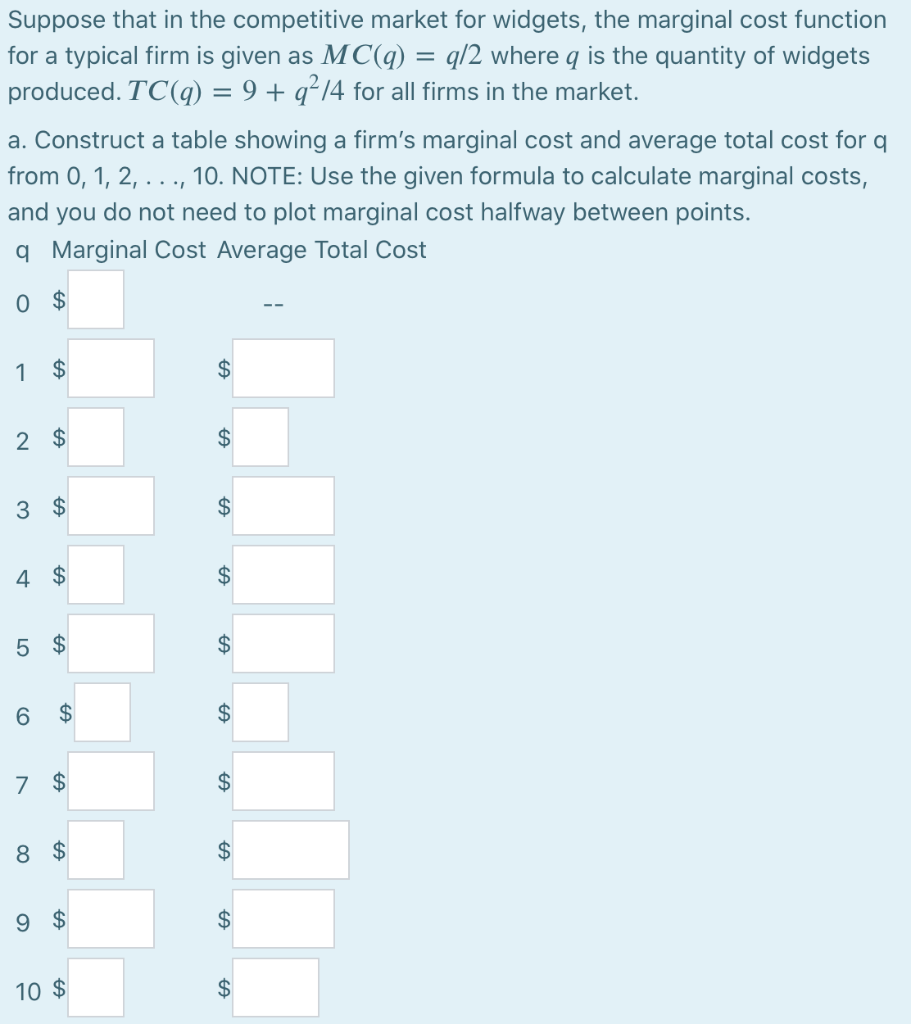
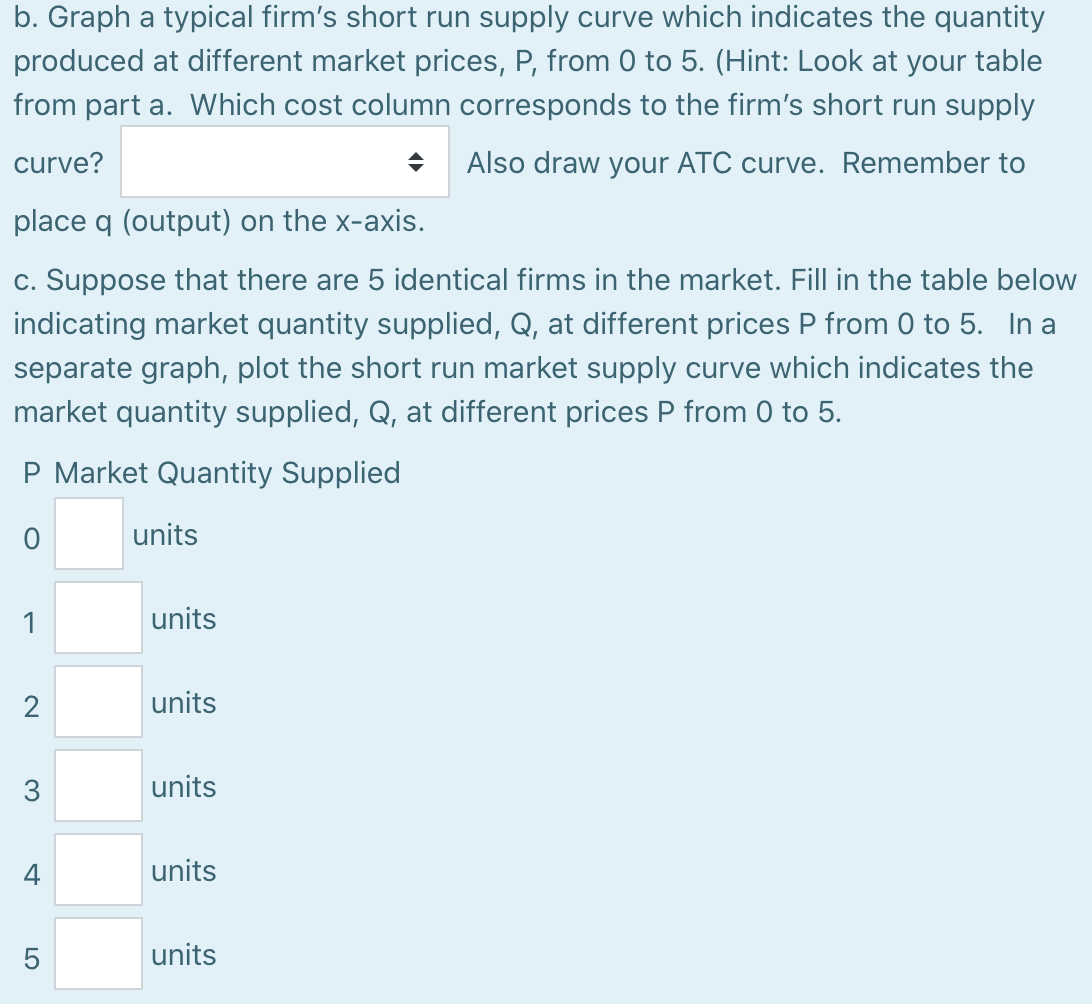
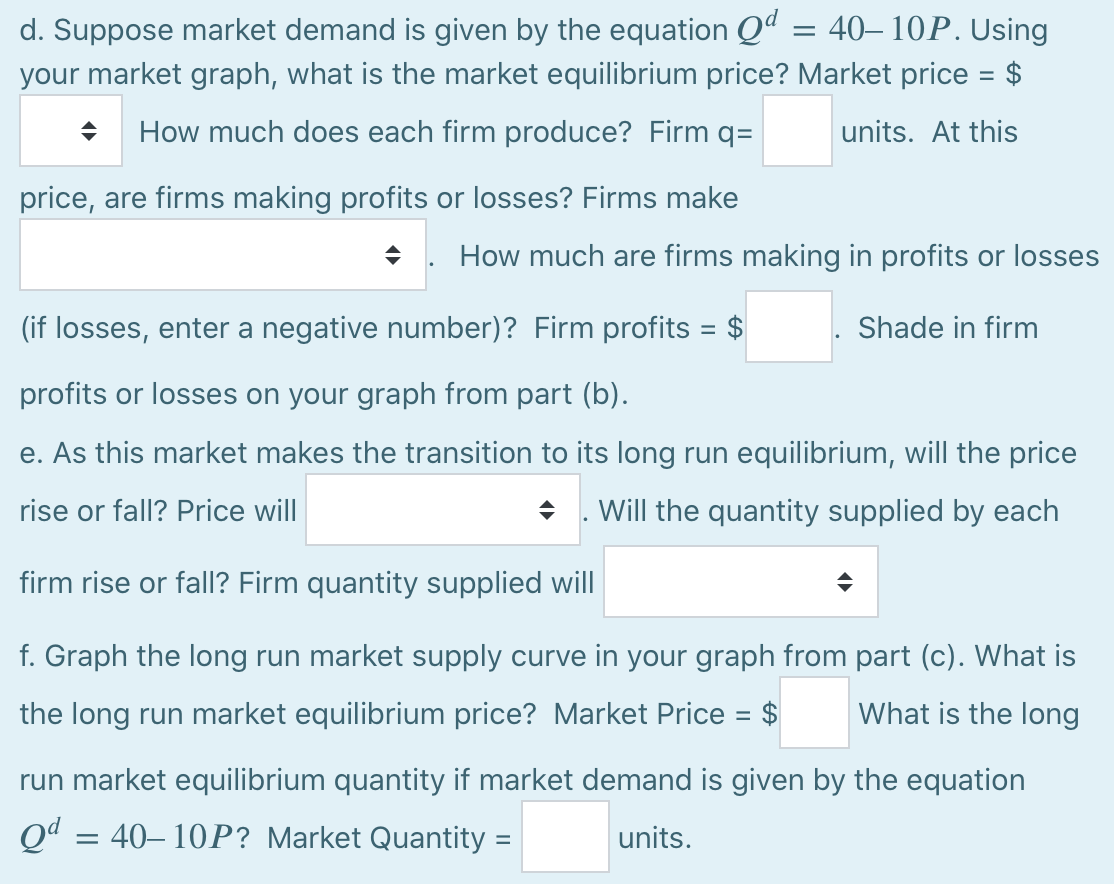
Suppose that in the competitive market for widgets, the marginal cost function for a typical firm is given as MC(q) : q/2 where q is the quantity of widgets produced. TC(q) = 9 + q/4 for all firms in the market. a. Construct a table showing a firm's marginal cost and average total cost for a from 0, 1, 2, ..., 10. NOTE: Use the given formula to calculate marginal costs, and you do not need to plot marginal cost halfway between points. q Marginal Cost Average Total Cost 0 $ 1 $ 2 $ $ 3 $ $ 4 $ $ 5 $ $ 6 $ $ 7 $ $ 8 $ A 9 $ $ 10 $ $ b. Graph a typical firm's short run supply curve which indicates the quantity produced at different market prices, P, from 0 to 5. (Hint: Look at your table from part a. Which cost column corresponds to the firm's short run supply curve? Also draw your ATC curve. Remember to place q (output) on the x-axis. c. Suppose that there are 5 identical firms in the market. Fill in the table below indicating market quantity supplied, Q, at different prices P from 0 to 5. In a separate graph, plot the short run market supply curve which indicates the market quantity supplied, Q, at different prices P from 0 to 5. P Market Quantity Supplied 0 units 1 units 2 units units 4 units 5 units = d. Suppose market demand is given by the equation Qd 4010P. Using your market graph, what is the market equilibrium price? Market price = $ How much does each firm produce? Firm q= units. At this price, are firms making profits or losses? Firms make How much are firms making in profits or losses (if losses, enter a negative number)? Firm profits = $ Shade in firm profits or losses on your graph from part (b). e. As this market makes the transition to its long run equilibrium, will the price rise or fall? Price will Will the quantity supplied by each firm rise or fall? Firm quantity supplied will f. Graph the long run market supply curve in your graph from part (c). What is the long run market equilibrium price? Market Price = $ What is the long run market equilibrium quantity if market demand is given by the equation Qd = 4010P? Market Quantity = units. Suppose that in the competitive market for widgets, the marginal cost function for a typical firm is given as MC(q) : q/2 where q is the quantity of widgets produced. TC(q) = 9 + q/4 for all firms in the market. a. Construct a table showing a firm's marginal cost and average total cost for a from 0, 1, 2, ..., 10. NOTE: Use the given formula to calculate marginal costs, and you do not need to plot marginal cost halfway between points. q Marginal Cost Average Total Cost 0 $ 1 $ 2 $ $ 3 $ $ 4 $ $ 5 $ $ 6 $ $ 7 $ $ 8 $ A 9 $ $ 10 $ $ b. Graph a typical firm's short run supply curve which indicates the quantity produced at different market prices, P, from 0 to 5. (Hint: Look at your table from part a. Which cost column corresponds to the firm's short run supply curve? Also draw your ATC curve. Remember to place q (output) on the x-axis. c. Suppose that there are 5 identical firms in the market. Fill in the table below indicating market quantity supplied, Q, at different prices P from 0 to 5. In a separate graph, plot the short run market supply curve which indicates the market quantity supplied, Q, at different prices P from 0 to 5. P Market Quantity Supplied 0 units 1 units 2 units units 4 units 5 units = d. Suppose market demand is given by the equation Qd 4010P. Using your market graph, what is the market equilibrium price? Market price = $ How much does each firm produce? Firm q= units. At this price, are firms making profits or losses? Firms make How much are firms making in profits or losses (if losses, enter a negative number)? Firm profits = $ Shade in firm profits or losses on your graph from part (b). e. As this market makes the transition to its long run equilibrium, will the price rise or fall? Price will Will the quantity supplied by each firm rise or fall? Firm quantity supplied will f. Graph the long run market supply curve in your graph from part (c). What is the long run market equilibrium price? Market Price = $ What is the long run market equilibrium quantity if market demand is given by the equation Qd = 4010P? Market Quantity = units
Step by Step Solution
There are 3 Steps involved in it

Get step-by-step solutions from verified subject matter experts