

Question: 17 These graphs show the temperature T degrees Celsius as a function of time t hours Match each graph with its vertical intercept and rate
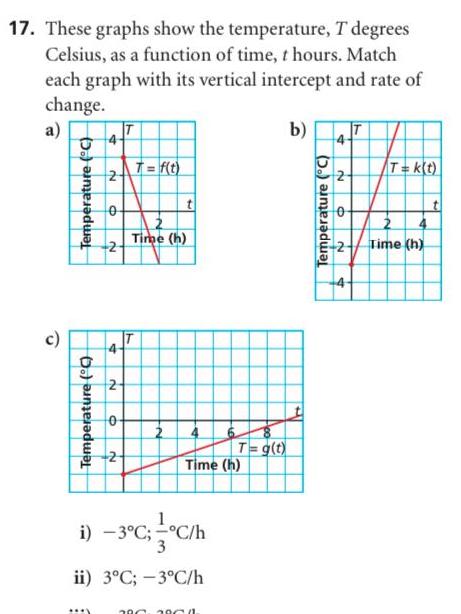

17 These graphs show the temperature T degrees Celsius as a function of time t hours Match each graph with its vertical intercept and rate of change a c Temperature C Temperature C 2 0 2 4 2 0 N T f t Time h i 3 C C h 3 ii 3 C 3 C h Time h T g t 380 3900 b Temperature C 2 6 N T k t Time h 2
Step by Step Solution
There are 3 Steps involved in it
1 Expert Approved Answer
Step: 1 Unlock

Question Has Been Solved by an Expert!
Get step-by-step solutions from verified subject matter experts
Step: 2 Unlock
Step: 3 Unlock