

Question: 18. (a) (b) (C) (d) (e) (f) The UMUC Daily News reported that the color distribution for plain M&M's was: 40% brown, 20% yellow, 20%
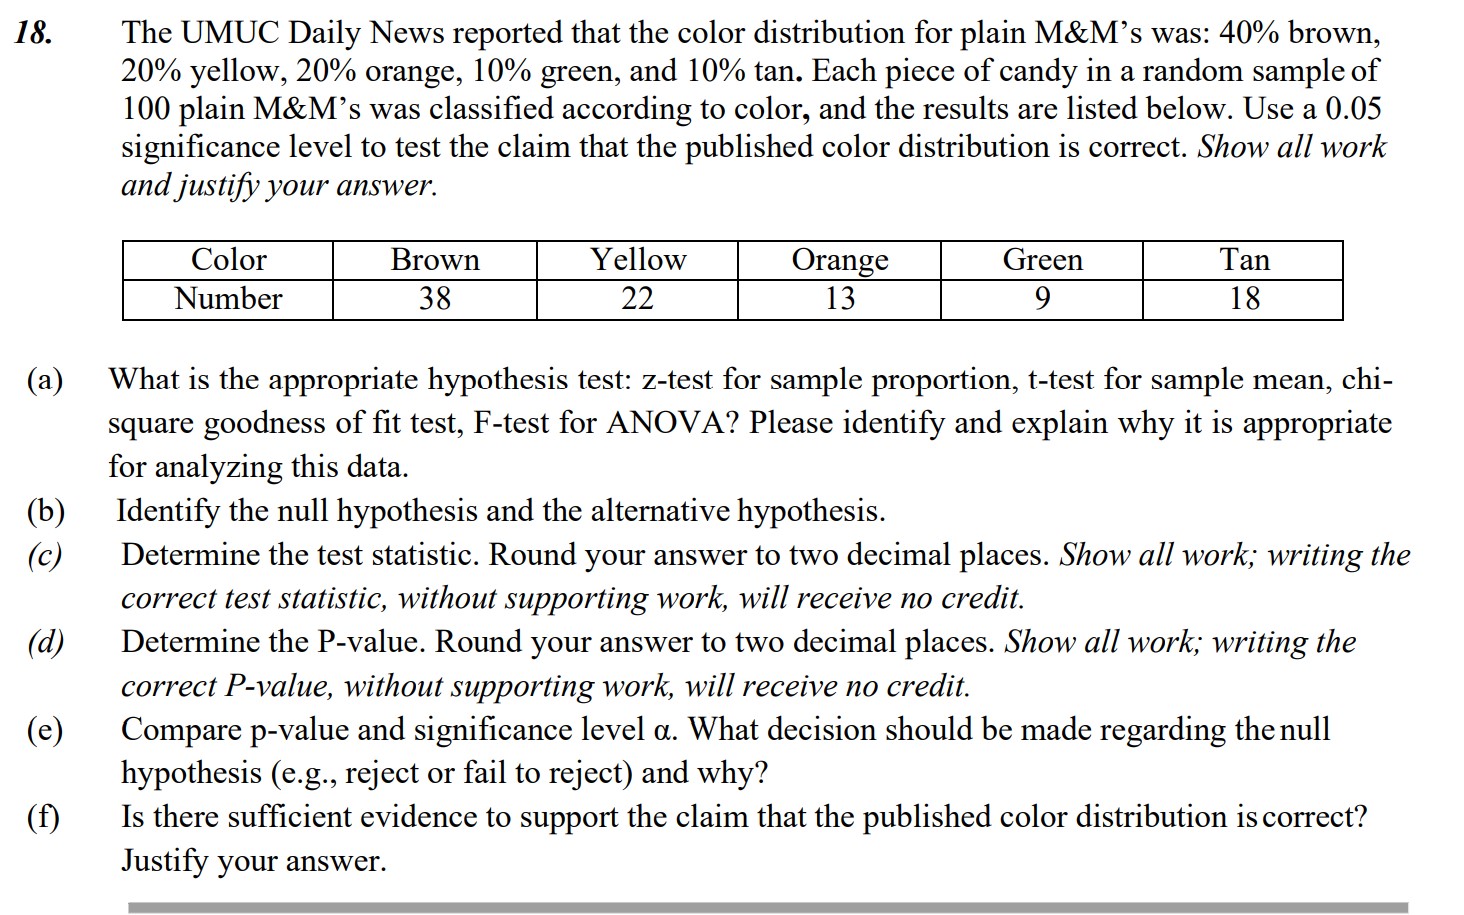
18. (a) (b) (C) (d) (e) (f) The UMUC Daily News reported that the color distribution for plain M&M's was: 40% brown, 20% yellow, 20% orange, 10% green, and 10% tan. Each piece of candy in a random sample of 100 plain M&M's was classied according to color, and the results are listed below. Use a 0.05 signicance level to test the claim that the published color distribution is correct. Show all work and justify your answer. Number 38 22 13 9 18 W'hat is the appropriate hypothesis test: z-test for sample proportion, t-test for sample mean, chi- square goodness of t test, F-test for ANOVA? Please identify and explain why it is appropriate for analyzing this data. Identify the null hypothesis and the alternative hypothesis. Determine the test statistic. Round your answer to two decimal places. Show all work; writing the correct test statistic, without supporting work, will receive no credit. Determine the P-value. Round your answer to two decimal places. Show all work; writing the correct Pvalue, without supporting work, will receive no credit. Compare p-value and signicance level a. What decision should be made regarding the null hypothesis (e.g., reject or fail to reject) and why? Is there sufcient evidence to support the claim that the published color distribution is correct? Justify your
Step by Step Solution
There are 3 Steps involved in it

Get step-by-step solutions from verified subject matter experts