

Question: 18 Discussion Data Sheet Next, let's consider the general rate expression for reaction (1a): (3) rate = k [H2O21 0' (H+]$ where k is the
![for reaction (1a): (3) rate = k [H2O21 0' (H+]$ where k](https://dsd5zvtm8ll6.cloudfront.net/si.experts.images/questions/2024/09/66f902e85cde5_23966f902e7e98ef.jpg)
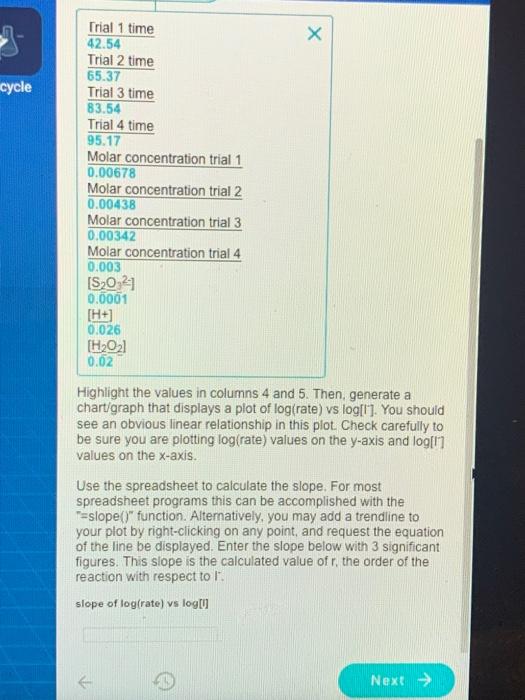
18 Discussion Data Sheet Next, let's consider the general rate expression for reaction (1a): (3) rate = k [H2O21 0' (H+]$ where k is the rate constant, and q, r and s are the orders of the reaction with respect to each reactant. Remember from your kinetics studies that these reaction orders are not the same as the stoichiometric coefficients for the reaction, and that the reaction orders must be determined experimentally. Taking the log of both sides of this rate expression gives. (4) log(rate) = log k + q log[H202] + r log[1] + s log[H] Since the rate constant and the concentrations of all the reactants except for l' are the same in the four reactions, the equation simplifies to the following: (5) log(rate) = rlog 0 + constant 19 Discussion Data Sheet As you know from algebra, linear functions have the form: y = mx + b where m is the slope and b is the y-axis intercept of the line. Note that eq. 5 on the previous page is a linear function, where y = log (rate) and x = log(l). The slope, m, of this linear function will be r. Recall that r is the order of the reaction with respect to the l reactant. 20 Discussion Data Sheet Use a spreadsheet program (OpenOffice or Excel) to set up five columns as follows: time(s) rate(s) log[/7 ] log(rate) Reaction rate can be calculated as the inverse of the elapsed time for each run, and has units of "1/s" (or st). Each row in the spreadsheet will contain data and calculated values for one of the four trials. Enter each of the initial iodide concentrations for the four reactions (calculated earlier in this discussion section on page 15) in separate rows under the first column, the corresponding reaction times you recorded in the second column, and the reciprocal of the reaction times in the third column. Set the spreadsheet to calculate the log10 of iodide concentration and log10 of reaction rate in the 4th and 5th columns respectively x cycle Trial 1 time 42.54 Trial 2 time 65.37 Trial 3 time 83.54 Trial 4 time 95.17 Molar concentration trial 1 0.00678 Molar concentration trial 2 0.00438 Molar concentration trial 3 0.00342 Molar concentration trial 4 0.003 [S20 21 0.0001 [H+) 0.026 [H2021 0.02 Highlight the values in columns 4 and 5. Then, generate a chart/graph that displays a plot of log(rate) vs log[l]. You should see an obvious linear relationship in this plot. Check carefully to be sure you are plotting log(rate) values on the y-axis and log[1] values on the x-axis. Use the spreadsheet to calculate the slope. For most spreadsheet programs this can be accomplished with the T-slope()" function. Alternatively, you may add a trendline to your plot by right-clicking on any point, and request the equation of the line be displayed. Enter the slope below with 3 significant figures. This slope is the calculated value of r, the order of the reaction with respect to 1". slope of log(rate) vs log Next >
Step by Step Solution
There are 3 Steps involved in it

Get step-by-step solutions from verified subject matter experts