

Question: 19. The graph of a variable cost per unit when plotted against its related activity base appears as a: a. circle. b. rectangle. C. Straight
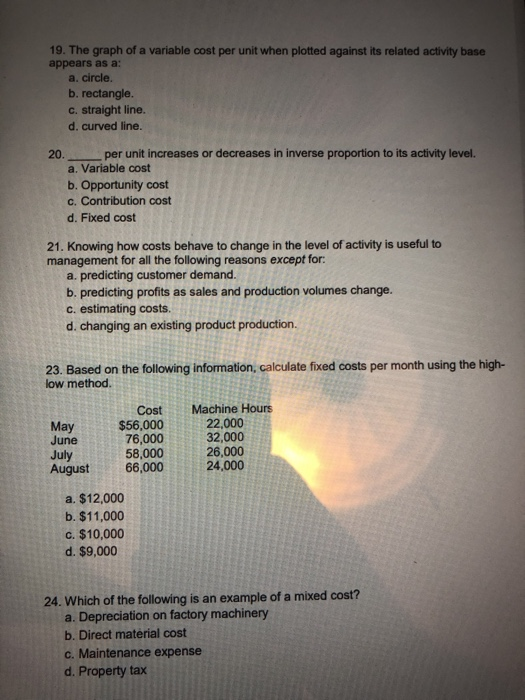
19. The graph of a variable cost per unit when plotted against its related activity base appears as a: a. circle. b. rectangle. C. Straight line. d. curved line. 20. per unit increases or decreases in inverse proportion to its activity level. a. Variable cost b. Opportunity cost c. Contribution cost d. Fixed cost 21. Knowing how costs behave to change in the level of activity is useful to management for all the following reasons except for a. predicting customer demand. b. predicting profits as sales and production volumes change. c. estimating costs d. changing an existing product production. 23. Based on the following information, calculate fixed costs per month using the high- low method. Cost Machine Hours $56,000 76,000 58,000 August66,00024.000 22,000 32,000 26,000 May June July a. $12,000 b. $11,000 c. $10,000 d. $9,000 24. Which of the following is an example of a mixed cost? a. Depreciation on factory machinery b. Direct material cost c. Maintenance expense d. Property tax
Step by Step Solution
There are 3 Steps involved in it

Get step-by-step solutions from verified subject matter experts