

Question: 19-A real estate agent collected data on the size and selling price of 12 recently sold homes in her city. The scatterplot is shown below:
19-A real estate agent collected data on the size and selling price of 12 recently sold homes in her city. The scatterplot is shown below:
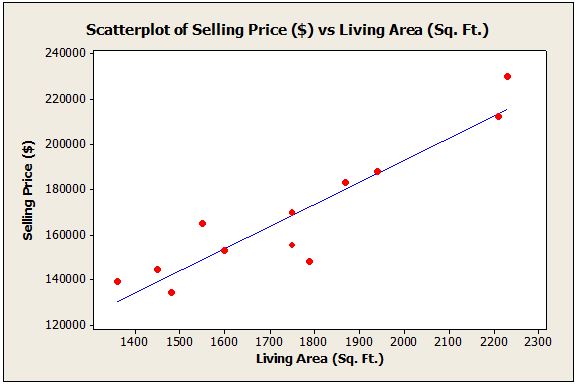
Scatterplot of Selling Price ($) vs Living Area (Sq. Ft.) 243m: 223120: 203420: 133m: Selling Price (13) 163120: 14]E0: 12]E0: 1400 1500 1600 1200 1800 1900 2000 2100 2200 2303 Living Area (Sq. Ft.)
Step by Step Solution
There are 3 Steps involved in it
1 Expert Approved Answer
Step: 1 Unlock

Question Has Been Solved by an Expert!
Get step-by-step solutions from verified subject matter experts
Step: 2 Unlock
Step: 3 Unlock