

Question: 1a 1b Question 11 A range control chart (R-chart) was developed with LCLR=0 and UCLR=2.50. Similarly, an X-bar chart was developed with LCL=15.0 and UCL=24.0.
1a 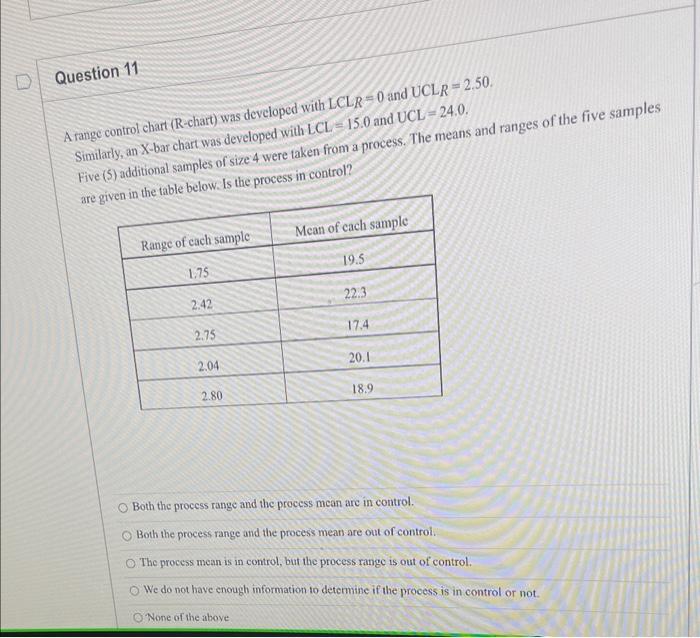
1b
Step by Step Solution
There are 3 Steps involved in it
1 Expert Approved Answer
Step: 1 Unlock

Question Has Been Solved by an Expert!
Get step-by-step solutions from verified subject matter experts
Step: 2 Unlock
Step: 3 Unlock