

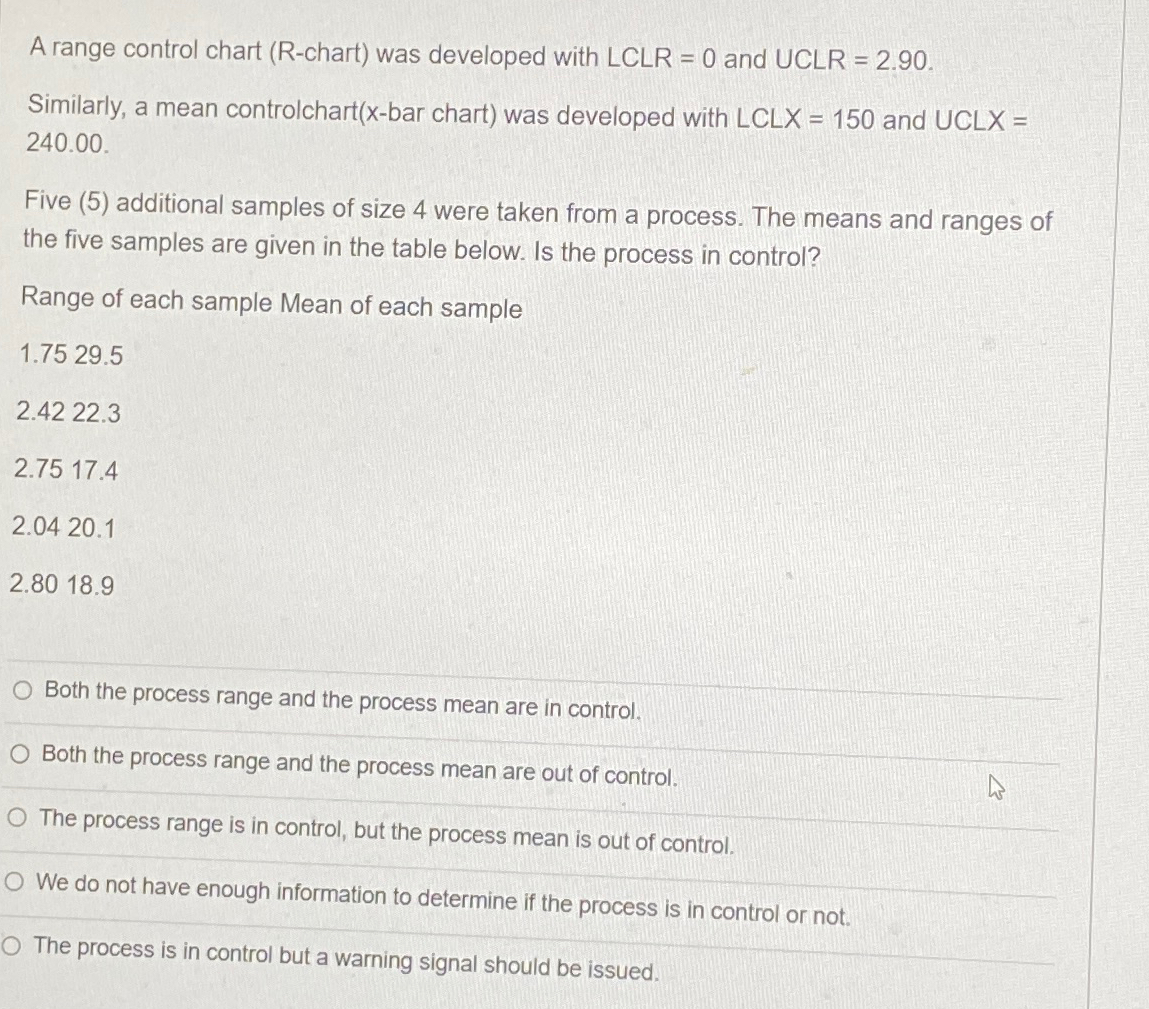
Question: A range control chart ( R - chart ) was developed with L C L R = 0 and UCLR = 2 . 9 0
A range control chart chart was developed with and UCLR
Similarly, a mean controlchartbar chart was developed with and UCLX
Five additional samples of size were taken from a process. The means and ranges of the five samples are given in the table below. Is the process in control?
Range of each sample Mean of each sample
Both the process range and the process mean are in control.
Both the process range and the process mean are out of control.
The process range is in control, but the process mean is out of control.
We do not have enough information to determine if the process is in control or not.
The process is in control but a warning signal should be issued.
Step by Step Solution
There are 3 Steps involved in it
1 Expert Approved Answer
Step: 1 Unlock

Question Has Been Solved by an Expert!
Get step-by-step solutions from verified subject matter experts
Step: 2 Unlock
Step: 3 Unlock