

Question: 1.a. produce a Scatter Plot using the total population for each of the years from the Probability Island.The horizontal axis should always represent time. b.
1.a. produce a Scatter Plot using the total population for each of the years from the Probability Island.The horizontal axis should always represent time.
b. Use linear regression or a trendline in Excel to find the equation of the best fit line.
c. Find the Correlation Coefficient.Explain what this means for your data.
d. Use the equation to predict the population in year 20.
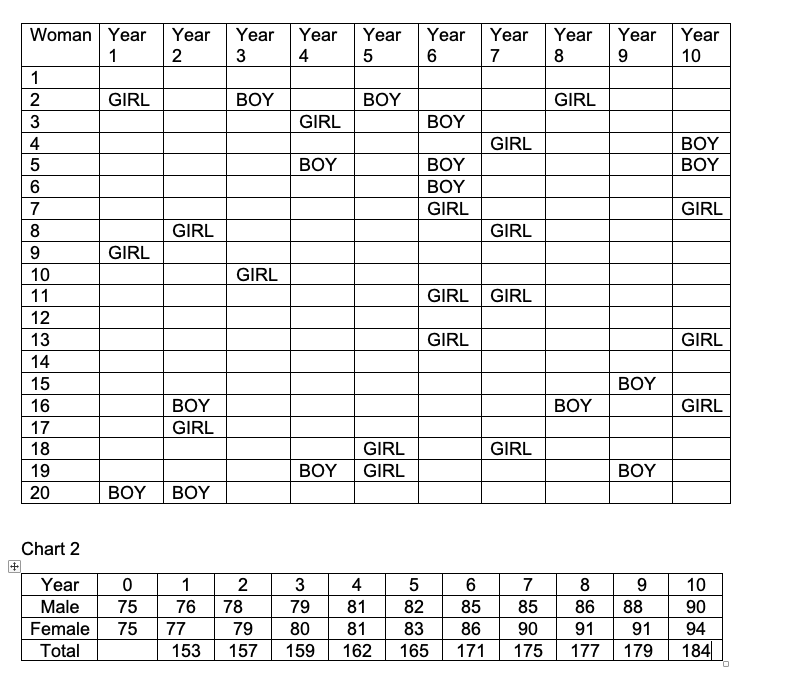
Woman Year Year Year Year Year Year Year Year Year Year 2 3 4 5 6 7 8 9 10 1 2 GIRL BOY BOY GIRL 3 GIRL BOY 4 GIRL BOY 5 BOY BOY BOY 6 BOY 7 GIRL GIRL 8 GIRL GIRL 9 GIRL 10 GIRL 11 GIRL GIRL 12 13 GIRL GIRL 14 15 BOY 16 BOY BOY GIRL 17 GIRL 18 GIRL GIRL 19 BOY GIRL BOY 20 BOY BOY Chart 2 Year 0 1 2 3 4 5 6 7 8 9 10 Male 75 76 78 79 81 82 85 85 86 88 90 Female 75 77 79 80 81 83 86 90 91 91 94 Total 153 157 159 162 165 171 175 177 179 184
Step by Step Solution
There are 3 Steps involved in it

Get step-by-step solutions from verified subject matter experts