

Question: Q1 a. Create a Scatter Plot using the total population for each of the years from the Probability Island. The horizontal axis should always represent
Q1
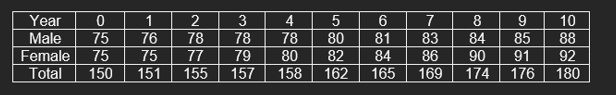
a. Create a Scatter Plot using the total population for each of the years from the Probability Island. The horizontal axis should always represent time. b. Use linear regression or a trendline in Excel to find the equation of the best fit line. c. Find the Correlation Coefficient. Explain what this means for your data. d. Use the equation to predict the population in year 20.
Q2
Graph the equation. c. Compare the slope of the Linear Regression Line of question 1 with the slope of this line. Provide an explanation of why they may similar or differ. d. Use the equation to predict the population in year 20.
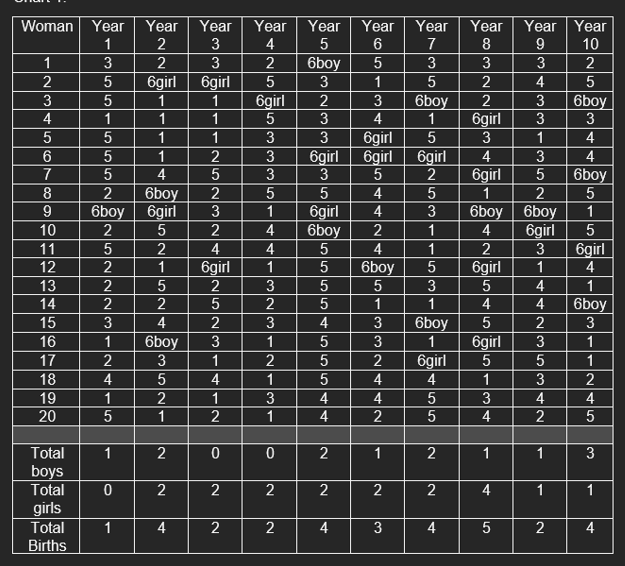
Woman Year 10 NN | 559] Year 7 3 5 6boy_ 1 M M |N| | | 1 5 olu Nuru ch w Year 1 3 5 5 1 5 5 5 2 6boy 2 5 2 2 2 3 1 2 4 1 5 1 2 3 4 5 6 7 8 9 10 11 12 13 14 15 16 17 18 19 20 NI Year 3 3 6girl 1 1 1 2 5 2 3 2 4 6girl 2 5 2 3 1 4 1 2 6girl 1 1 1 1 4 6boy 6girl 5 2 1 5 2 4 6boy 3 5 2 1 Year 4 2 5 6girl 5 3 3 3 5 1 4 4 1 3 2 3 1 2 1 3 1 Year Year 5 6 6boy 5 3 1 2 3 3 4 3 6girl 6girl 6girl 3 5 5 4 6girl 4 6bo 2 5 4 5 6boy 5 5 5 1 4 3 5 3 5 2 5 4 4 4 4 2 ANA Year 8 3 2 2 6girl 3 4 6girl 1 6boy 4 2 6girl 5 4 5 6girl 5 1 3 4 | | | | | ANUNU Year Year 9 3 2 4 5 3 6boy 3 3 1 4 3 4 5 6boy 2 5 6boy 1 6gi 5 3 6girl 1 4 4 1 4 6boy 2 3 3 1 5 1 3 2 4 4 2 5 6girl 2 5 3 1 1 5 3 1 6boy 1 6girl 4 5 5 5 A|A|o|u|os|o|oo|o| | | | N| AN Now O||> 1 2 0 0 N 1 N 1 1 3 0 N 2 N 2 N N 2 2 4 1 1 Total boys Total girls Total Births 1 4 NI 2 2 4 3 4 5 2 4 |03 CON Year Male Female Total 75 75 150 1 76 75 151 2 78 77 155 3 78 79 157 4 78 80 158 5 80 82 162 6 81 84 165 7 83 86 169 8 84 90 174 9 85 91 176 10 88 92 180 Woman Year 10 NN | 559] Year 7 3 5 6boy_ 1 M M |N| | | 1 5 olu Nuru ch w Year 1 3 5 5 1 5 5 5 2 6boy 2 5 2 2 2 3 1 2 4 1 5 1 2 3 4 5 6 7 8 9 10 11 12 13 14 15 16 17 18 19 20 NI Year 3 3 6girl 1 1 1 2 5 2 3 2 4 6girl 2 5 2 3 1 4 1 2 6girl 1 1 1 1 4 6boy 6girl 5 2 1 5 2 4 6boy 3 5 2 1 Year 4 2 5 6girl 5 3 3 3 5 1 4 4 1 3 2 3 1 2 1 3 1 Year Year 5 6 6boy 5 3 1 2 3 3 4 3 6girl 6girl 6girl 3 5 5 4 6girl 4 6bo 2 5 4 5 6boy 5 5 5 1 4 3 5 3 5 2 5 4 4 4 4 2 ANA Year 8 3 2 2 6girl 3 4 6girl 1 6boy 4 2 6girl 5 4 5 6girl 5 1 3 4 | | | | | ANUNU Year Year 9 3 2 4 5 3 6boy 3 3 1 4 3 4 5 6boy 2 5 6boy 1 6gi 5 3 6girl 1 4 4 1 4 6boy 2 3 3 1 5 1 3 2 4 4 2 5 6girl 2 5 3 1 1 5 3 1 6boy 1 6girl 4 5 5 5 A|A|o|u|os|o|oo|o| | | | N| AN Now O||> 1 2 0 0 N 1 N 1 1 3 0 N 2 N 2 N N 2 2 4 1 1 Total boys Total girls Total Births 1 4 NI 2 2 4 3 4 5 2 4 |03 CON Year Male Female Total 75 75 150 1 76 75 151 2 78 77 155 3 78 79 157 4 78 80 158 5 80 82 162 6 81 84 165 7 83 86 169 8 84 90 174 9 85 91 176 10 88 92 180
Step by Step Solution
There are 3 Steps involved in it

Get step-by-step solutions from verified subject matter experts