

Question: 1a. Using Table 5.1, determine the weighted average risk score for a borrower with these characteristics: D/A = .50; CDRC = .75; ROA= 3%; current
1a. Using Table 5.1, determine the weighted average risk score for a borrower with these characteristics: D/A = .50; CDRC = .75; ROA= 3%; current ratio = 10; operating ratio = .80; and LTV = .70. Are these characteristics relatively strong or weak
B. Using Table 5.2, determine the risk class for the loan characteristics in problem 5. Assume the borrower is rated average according to the management index (also note the differences in solvency measures).
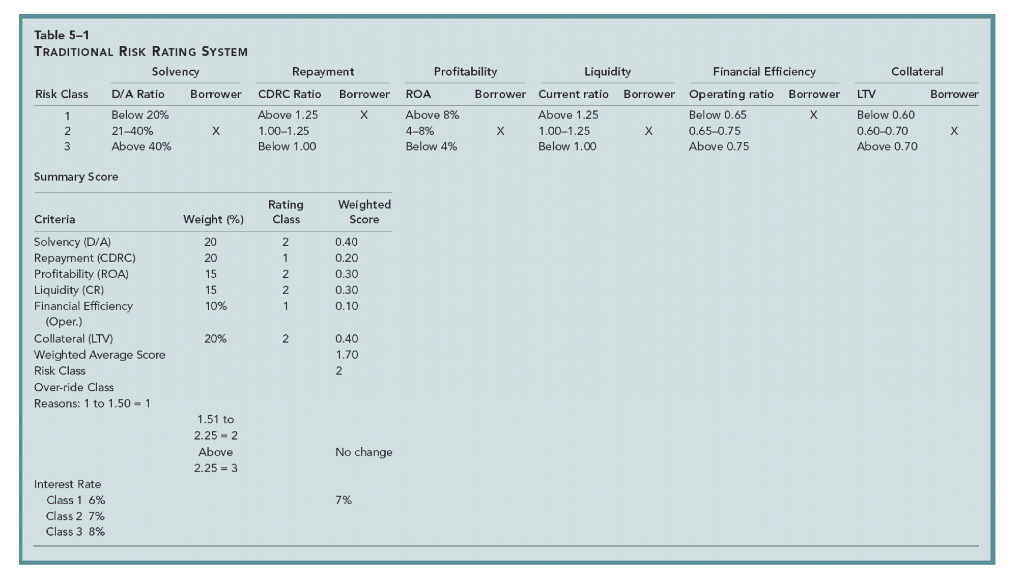
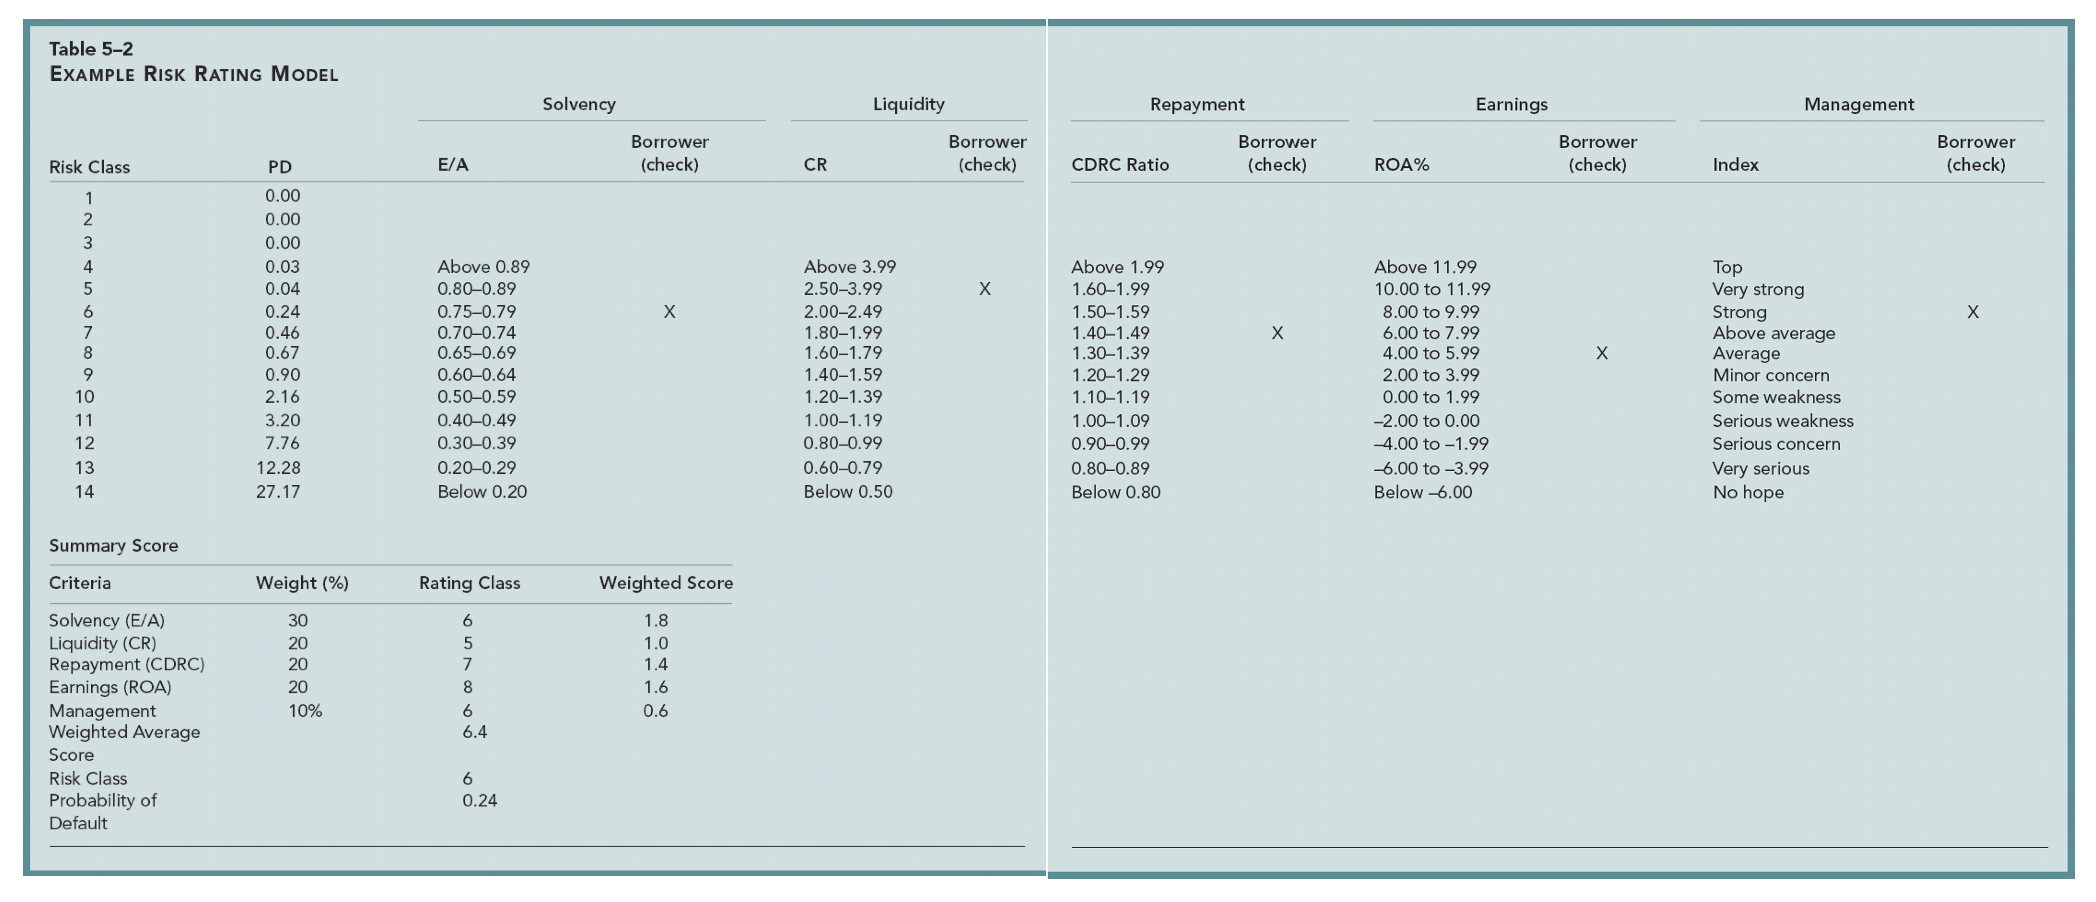
Collateral Table 5-1 TRADITIONAL RISK RATING SYSTEM Solvency Repayment Risk Class D/A Ratio A Borrower CDRC Ratio Borrower 1 Below 20% Above 1.25 2 21-40% X 1.00-1.25 3 Above 40% Below 1.00 LTV Borrower Profitability Liquidity Financial Efficiency ROA Borrower Current ratio Borrower Operating ratio Borrower Above 8% Above 1.25 Below 0.65 4-8% 1.00-1.25 0.65-0.75 Below 4% Below 1.00 Above 0.75 Below 0.60 0.60-0.70 Above 0.70 Summary Score Rating Class Weighted Score Criteria Weight (%) . 2 1 1 2 2 1 0.40 0.20 0.30 0.30 0.10 10% Solvency (D/A) Repayment (CDRC) Profitability (ROA) Liquidity (CR) Financial Efficiency (Oper.) Collateral (LTV) Weighted Average Score Risk Class Over-ride Class Reasons: 1 to 1.50 - 1 20% % 2 0.40 1.70 2 1.51 to 2.25 -2 Above 2.25 = 3 No change 7% Interest Rate Class 1 6% Class 2 7% Class 3 8% Table 5-2 EXAMPLE Risk RATING MODEL Solvency Liquidity Repayment Earnings Management Borrower (check) Borrower (check) Borrower (check) Borrower (check) Borrower (check) Risk Class PD E/A CR CDRC Ratio ROA% Index 1 2 3 X X X 0.00 0.00 0.00 0.03 0.04 0.24 0.46 0.67 0.90 2.16 3.20 7.76 12.28 27.17 4 5 6 7 8 9 10 11 12 13 14 X Above 0.89 0.800.89 0.750.79 0.700.74 0.65-0.69 0.600.64 0.50-0.59 0.400.49 0.30-0.39 0.20-0.29 Below 0.20 Above 3.99 2.503.99 2.00-2.49 1.80-1.99 1.601.79 1.40-1.59 1.201.39 1.00-1.19 0.800.99 0.60-0.79 Below 0.50 Above 1.99 1.60_1.99 1.501.59 1.401.49 1.30-1.39 1.201.29 1.10-1.19 1.00-1.09 0.90-0.99 0.800.89 Below 0.80 Above 11.99 10.00 to 11.99 8.00 to 9.99 6.00 to 7.99 4.00 to 5.99 2.00 to 3.99 0.00 to 1.99 -2.00 to 0.00 -4.00 to -1.99 -6.00 to -3.99 Below -6.00 Top Very strong Strong Above average Average Minor concern Some weakness Serious weakness Serious concern Very serious No hope Summary Score Criteria Weight (%) Rating Class Weighted Score 30 20 20 20 10% Solvency (E/A) Liquidity (CR) Repayment (CDRC) Earnings (ROA) Management Weighted Average Score Risk Class Probability of Default 6 5 7 8 6 6.4 1.8 1.0 1.4 1.6 0.6 6 0.24 Collateral Table 5-1 TRADITIONAL RISK RATING SYSTEM Solvency Repayment Risk Class D/A Ratio A Borrower CDRC Ratio Borrower 1 Below 20% Above 1.25 2 21-40% X 1.00-1.25 3 Above 40% Below 1.00 LTV Borrower Profitability Liquidity Financial Efficiency ROA Borrower Current ratio Borrower Operating ratio Borrower Above 8% Above 1.25 Below 0.65 4-8% 1.00-1.25 0.65-0.75 Below 4% Below 1.00 Above 0.75 Below 0.60 0.60-0.70 Above 0.70 Summary Score Rating Class Weighted Score Criteria Weight (%) . 2 1 1 2 2 1 0.40 0.20 0.30 0.30 0.10 10% Solvency (D/A) Repayment (CDRC) Profitability (ROA) Liquidity (CR) Financial Efficiency (Oper.) Collateral (LTV) Weighted Average Score Risk Class Over-ride Class Reasons: 1 to 1.50 - 1 20% % 2 0.40 1.70 2 1.51 to 2.25 -2 Above 2.25 = 3 No change 7% Interest Rate Class 1 6% Class 2 7% Class 3 8% Table 5-2 EXAMPLE Risk RATING MODEL Solvency Liquidity Repayment Earnings Management Borrower (check) Borrower (check) Borrower (check) Borrower (check) Borrower (check) Risk Class PD E/A CR CDRC Ratio ROA% Index 1 2 3 X X X 0.00 0.00 0.00 0.03 0.04 0.24 0.46 0.67 0.90 2.16 3.20 7.76 12.28 27.17 4 5 6 7 8 9 10 11 12 13 14 X Above 0.89 0.800.89 0.750.79 0.700.74 0.65-0.69 0.600.64 0.50-0.59 0.400.49 0.30-0.39 0.20-0.29 Below 0.20 Above 3.99 2.503.99 2.00-2.49 1.80-1.99 1.601.79 1.40-1.59 1.201.39 1.00-1.19 0.800.99 0.60-0.79 Below 0.50 Above 1.99 1.60_1.99 1.501.59 1.401.49 1.30-1.39 1.201.29 1.10-1.19 1.00-1.09 0.90-0.99 0.800.89 Below 0.80 Above 11.99 10.00 to 11.99 8.00 to 9.99 6.00 to 7.99 4.00 to 5.99 2.00 to 3.99 0.00 to 1.99 -2.00 to 0.00 -4.00 to -1.99 -6.00 to -3.99 Below -6.00 Top Very strong Strong Above average Average Minor concern Some weakness Serious weakness Serious concern Very serious No hope Summary Score Criteria Weight (%) Rating Class Weighted Score 30 20 20 20 10% Solvency (E/A) Liquidity (CR) Repayment (CDRC) Earnings (ROA) Management Weighted Average Score Risk Class Probability of Default 6 5 7 8 6 6.4 1.8 1.0 1.4 1.6 0.6 6 0.24
Step by Step Solution
There are 3 Steps involved in it

Get step-by-step solutions from verified subject matter experts