Question: 1.Adding more X variables, interactions between X variables, and non-linear terms (e.g, X^2 or transforms) will always increase the adjusted R-squared of the regression model.
1.Adding more X variables, interactions between X variables, and non-linear terms (e.g, X^2 or transforms) will always increase the adjusted R-squared of the regression model. T/F
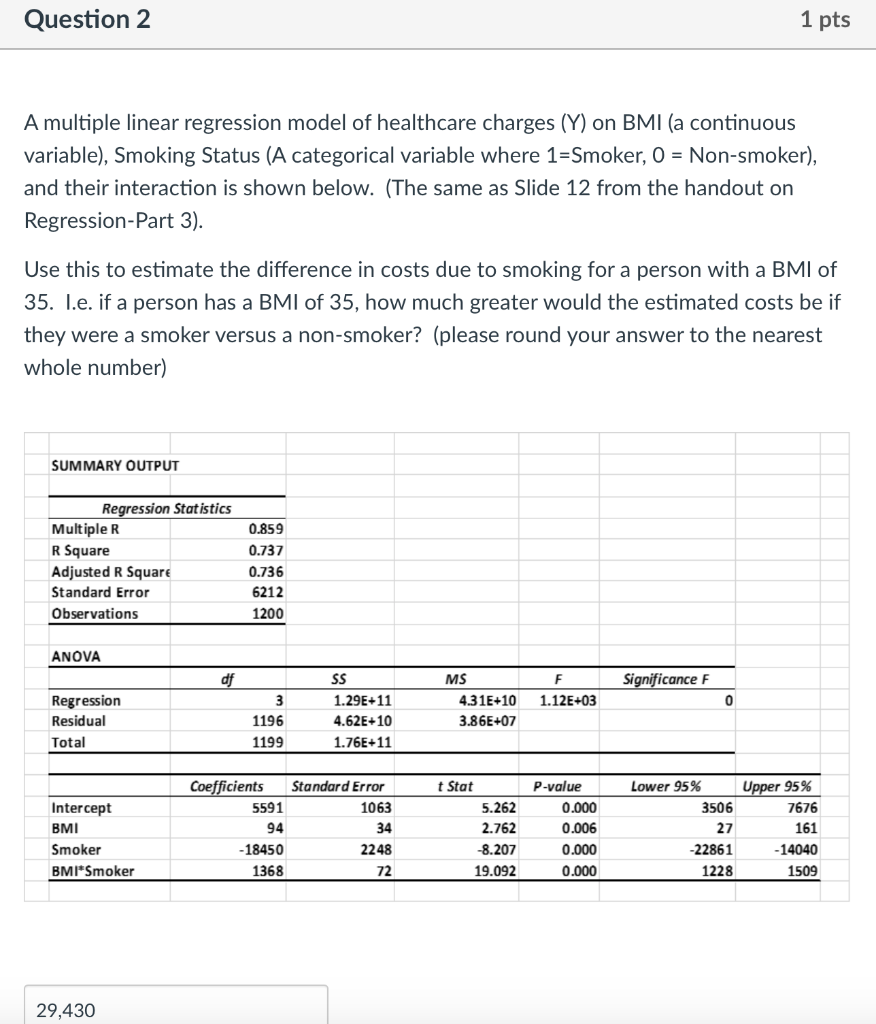
2.A multiple linear regression model of healthcare charges (Y) on BMI (a continuous variable), Smoking Status (A categorical variable where 1=Smoker, 0 = Non-smoker), and their interaction is shown below. (The same as Slide 12 from the handout on Regression-Part 3).
Use this to estimate the difference in costs due to smoking for a person with a BMI of 35. I.e. if a person has a BMI of 35, how much greater would the estimated costs be if they were a smoker versus a non-smoker? (please round your answer to the nearest whole number)
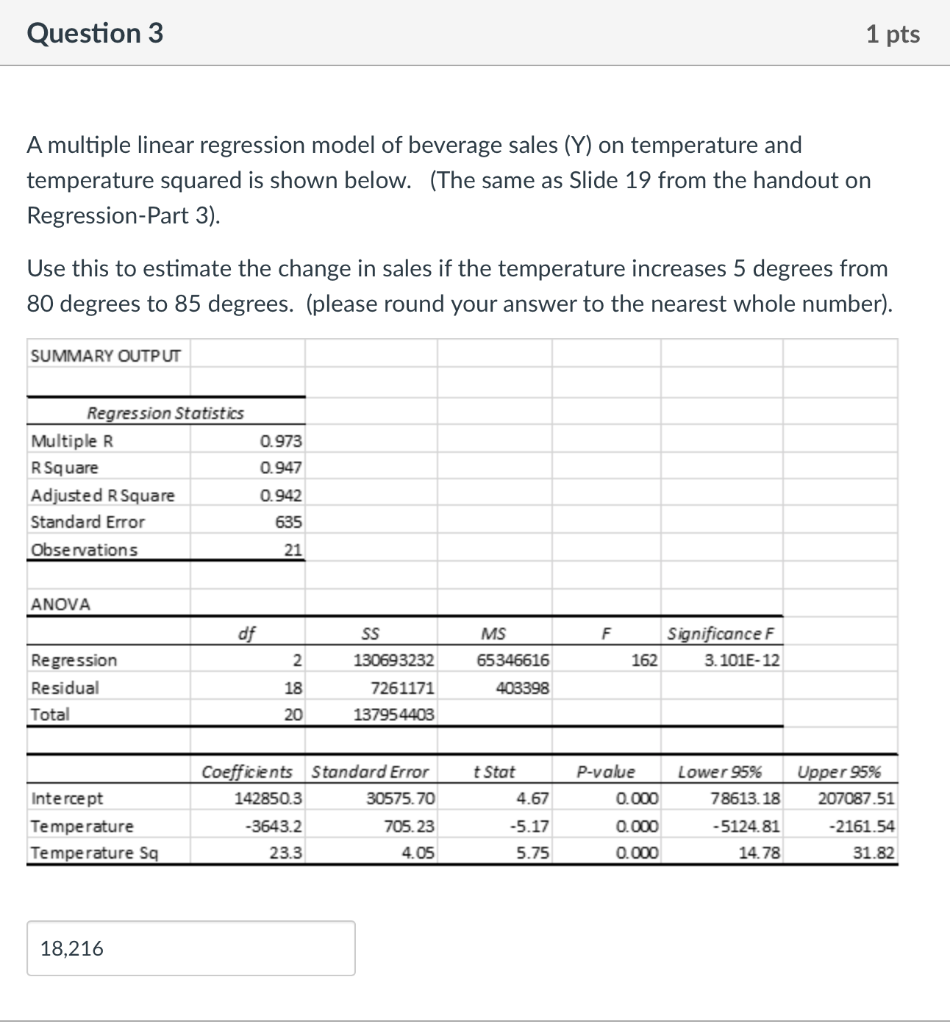
3.A multiple linear regression model of beverage sales (Y) on temperature and temperature squared is shown below.
Use this to estimate the change in sales if the temperature increases 5 degrees from 80 degrees to 85 degrees. (please round your answer to the nearest whole number).
Question 1 1 pts Adding more X variables, interactions between X variables, and non-linear terms (e.g, X^2 or transforms) will always increase the adjusted R-squared of the regression model. True False Question 2 1 pts A multiple linear regression model of healthcare charges (Y) on BMI (a continuous variable), Smoking Status (A categorical variable where 1=Smoker, 0 = Non-smoker), and their interaction is shown below. (The same as Slide 12 from the handout on Regression-Part 3). Use this to estimate the difference in costs due to smoking for a person with a BMI of 35. I.e. if a person has a BMI of 35, how much greater would the estimated costs be if they were a smoker versus a non-smoker? (please round your answer to the nearest whole number) SUMMARY OUTPUT Regression Statistics Multiple R R Square Adjusted R Square Standard Error Observations 0.859 0.737 0.736 6212 1200 ANOVA df Significance F F 1.12E+03 Regression Residual Total 0 MS 4.31E+10 3.86E+07 3 1196 SS 1.29E+11 4.62E+10 1.76E+11 1199 Intercept BMI Smoker BMISmoker Coefficients 5591 94 - 18450 1368 Standard Error 1063 34 2248 72 t Stat 5.262 2.762 -8.207 19.092 P-value 0.000 0.006 0.000 0.000 Lower 95% Upper 95% 3506 7676 27 161 -22861 -14040 1228 1509 29,430 Question 3 1 pts A multiple linear regression model of beverage sales (Y) on temperature and temperature squared is shown below. (The same as Slide 19 from the handout on Regression-Part 3). Use this to estimate the change in sales if the temperature increases 5 degrees from 80 degrees to 85 degrees. (please round your answer to the nearest whole number). SUMMARY OUTPUT 0.973 0.947 Regression Statistics Multiple R R Square Adjusted R Square Standard Error Observations 0.942 635 21 ANOVA df SS MS F Significance F 162 3.101E-12 2. Regression Residual Total 130693232 7261171 137954403 65346616 403398 18 20 Lower 95% t Stat 4.67 P-value 0.000 78613.18 Intercept Temperature Temperature Sq Coefficients Standard Error 142850.3 30575.70 -3643.2 705.23 23.3 4.05 Upper 95% 207087.51 -2161.54 31.82 -5.17 0.000 -5124.81 14.78 5.75 0.000 18,216


