

Question: 1.answer and explain Back to Assignment Attempts Keep the Highest / 2 1. Imports, exports, and the trade balance The following table shows the approximate
1.answer and explain
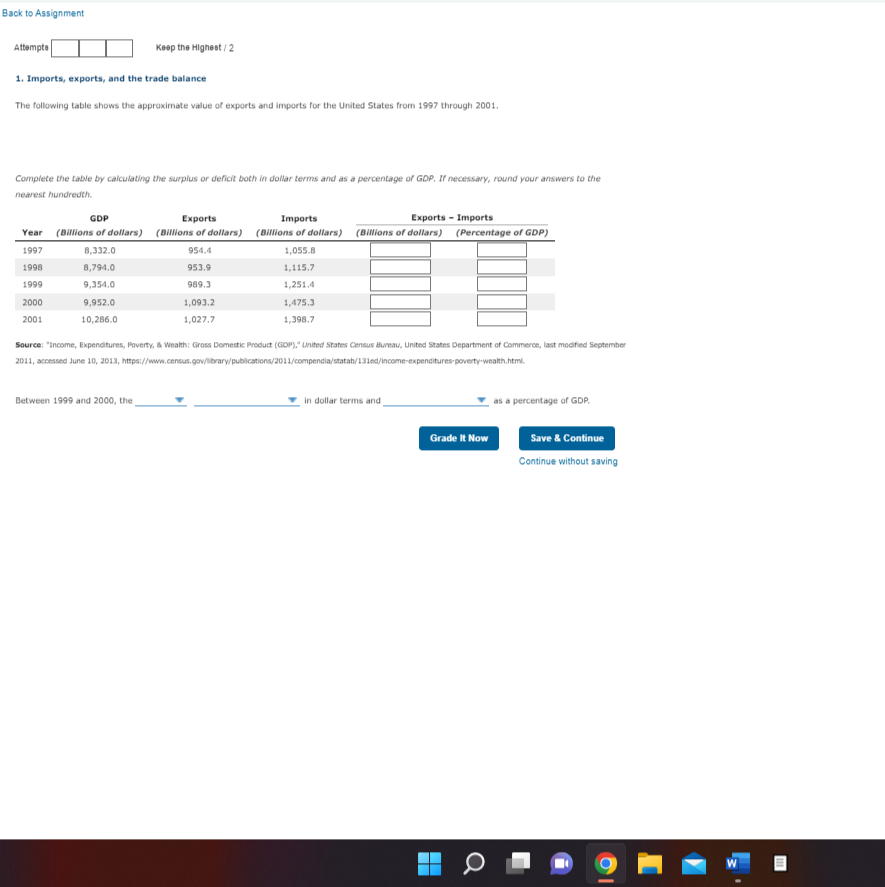
Back to Assignment Attempts Keep the Highest / 2 1. Imports, exports, and the trade balance The following table shows the approximate value of exports and imports for the United States from 1997 through 2001. Complete the table by calculating the surplus or deficit both in dollar terms and as a percentage of GDP. If necessary, round your answers to the nearest hundredth. GDP Exports Imports Exports - Imports Year (Billions of dollars) (Billions of dollars) (Billions of dollars) (Billions of dollars) (Percentage of GDP) 1997 8,332.0 954. 1,055.8 1998 8,794.0 953. 1,115.7 1999 9.354.0 989. 1,251.4 2000 9,952.0 1,093.2 1,475.3 2001 10,286.0 1,027.7 1,398.7 Source: "Income, Expenditures, Poverty, & Wealth: Gross Domestic Product (GDP)," United States Census Bureau, United States Department of Commerce, last modified September 2011, accessed June 10, 2013, https://www.c tions/2011/ce anditures-poverty-wealth.html. Between 1999 and 2000, the in dollar terms and 7 as a percentage of GDP. Grade It Now Save & Continue Continue without saving
Step by Step Solution
There are 3 Steps involved in it

Get step-by-step solutions from verified subject matter experts