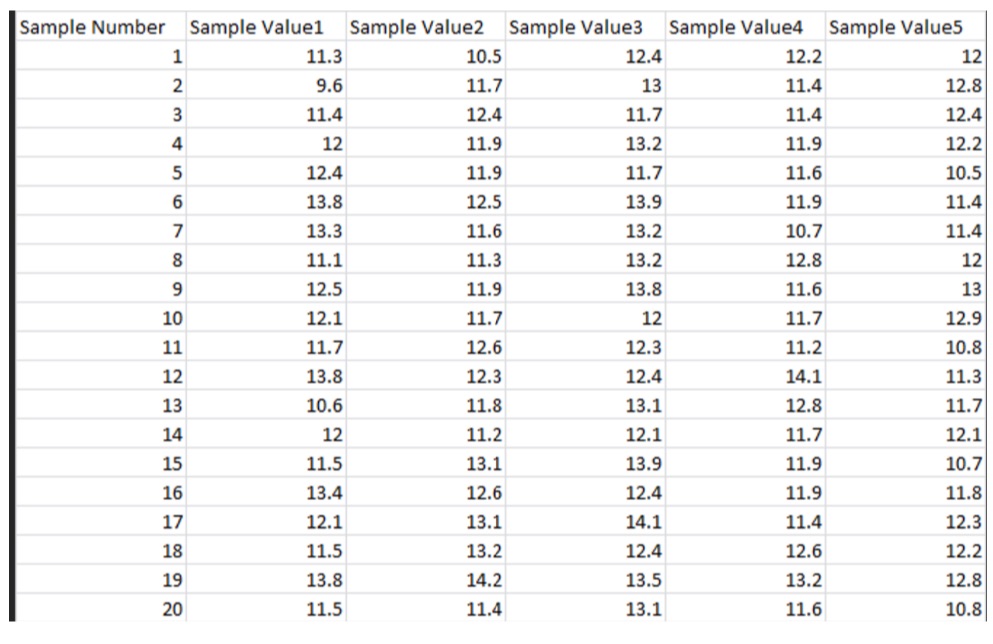
Question: (1)*Construct an X bar chart and anR chart.*Calculate and represent control limits Sample Number Sample Value1 Sample Value2 Sample Value3 Sample Value4 Sample Value5 11.3

(1)*Construct an X bar chart and anR chart.*Calculate and represent control limits

(1)*Construct an X bar chart and anR
Sample Number Sample Value1 Sample Value2 Sample Value3 Sample Value4 Sample Value5 11.3 10.5 12.4 12.2 12 N 9.6 11.7 13 11.4 12.8 W 11.4 12.4 11.7 11.4 12.4 12 11.9 13.2 11.9 12.2 12.4 11.9 11.7 11.6 10.5 13.8 12.5 13.9 11.9 11.4 13.3 11.6 13.2 10.7 11.4 11.1 11.3 13.2 12.8 12 12.5 11.9 13.8 11.6 13 12.1 11.7 12 11.7 12.9 11 11.7 12.6 12.3 11.2 10.8 12 13.8 12.3 12.4 14.1 11.3 13 10.6 11.8 13.1 12.8 11.7 14 12 11.2 12.1 11.7 12.1 15 11.5 13.1 13.9 11.9 10.7 16 13.4 12.6 12.4 11.9 11.8 17 12.1 13.1 14.1 11.4 12.3 18 11.5 13.2 12.4 12.6 12.2 19 13.8 14.2 13.5 13.2 12.8 20 11.5 11.4 13.1 11.6 10.8

Step by Step Solution

There are 3 Steps involved in it

1 Expert Approved Answer
Step: 1 Unlock blur-text-image
Question Has Been Solved by an Expert!

Get step-by-step solutions from verified subject matter experts

Step: 2 Unlock
Step: 3 Unlock

Students Have Also Explored These Related General Management Questions!