

Question: 1)Determine if the data is nominal, ordinal, interval or ratio and explain why. 2) Provide a summary table of all variables. Which crime has the
1)Determine if the data is nominal, ordinal, interval or ratio and explain why.
2) Provide a summary table of all variables. Which crime has the highest percentage and lowest percentage for each category? Which crime has the highest percentage in which neighbourhood and which crime has the lowest percentage in which neighbourhood?
3) Find the mean, median and mode for all variables.
4) Answer the following questions: a) Is this qualitative or quantitative data? b) Is this continuous or discrete data? c) Provide the rationale for your answers.
5) Calculate the variance and standard deviation for all variables and graph the results. Are the graphs a normal curve, positively skewed or negatively skewed? Explain the results.
6) Determine the range, interquartile range, mean absolute deviation, standard deviation using the empirical rule and Chebyshev's theorem for all variables
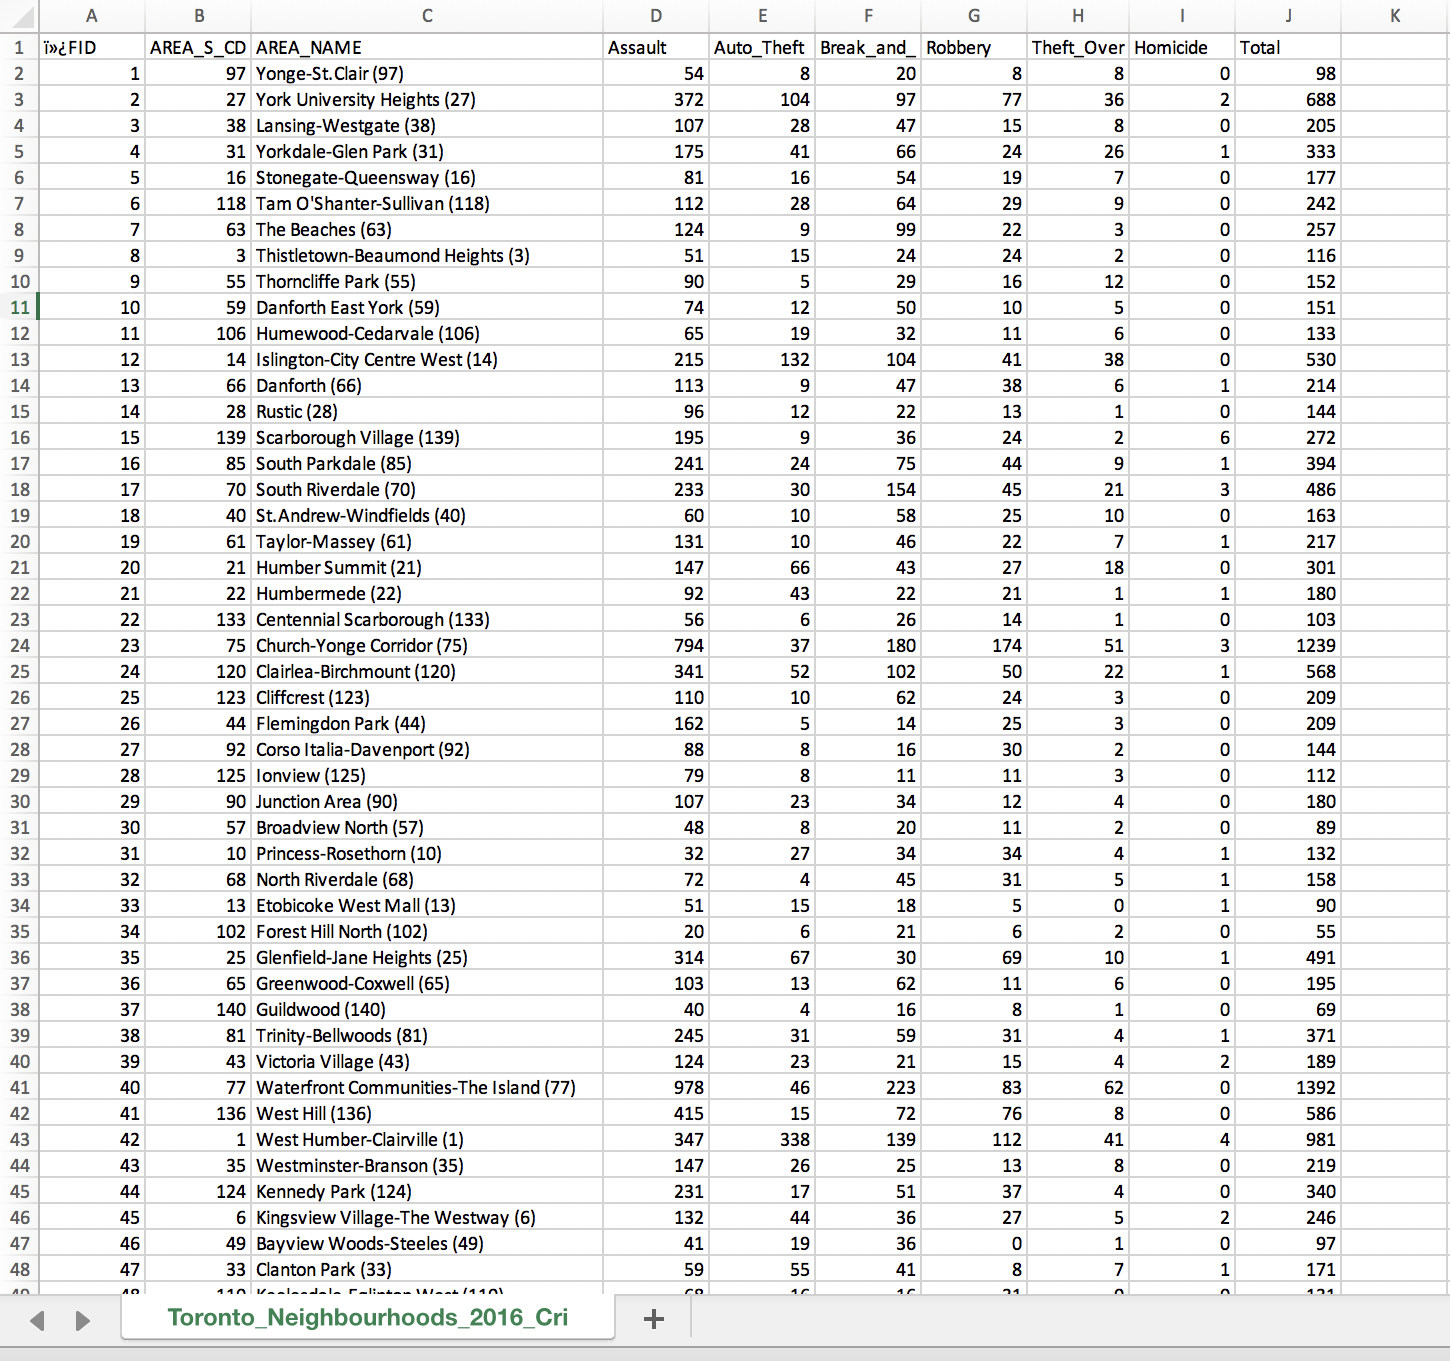
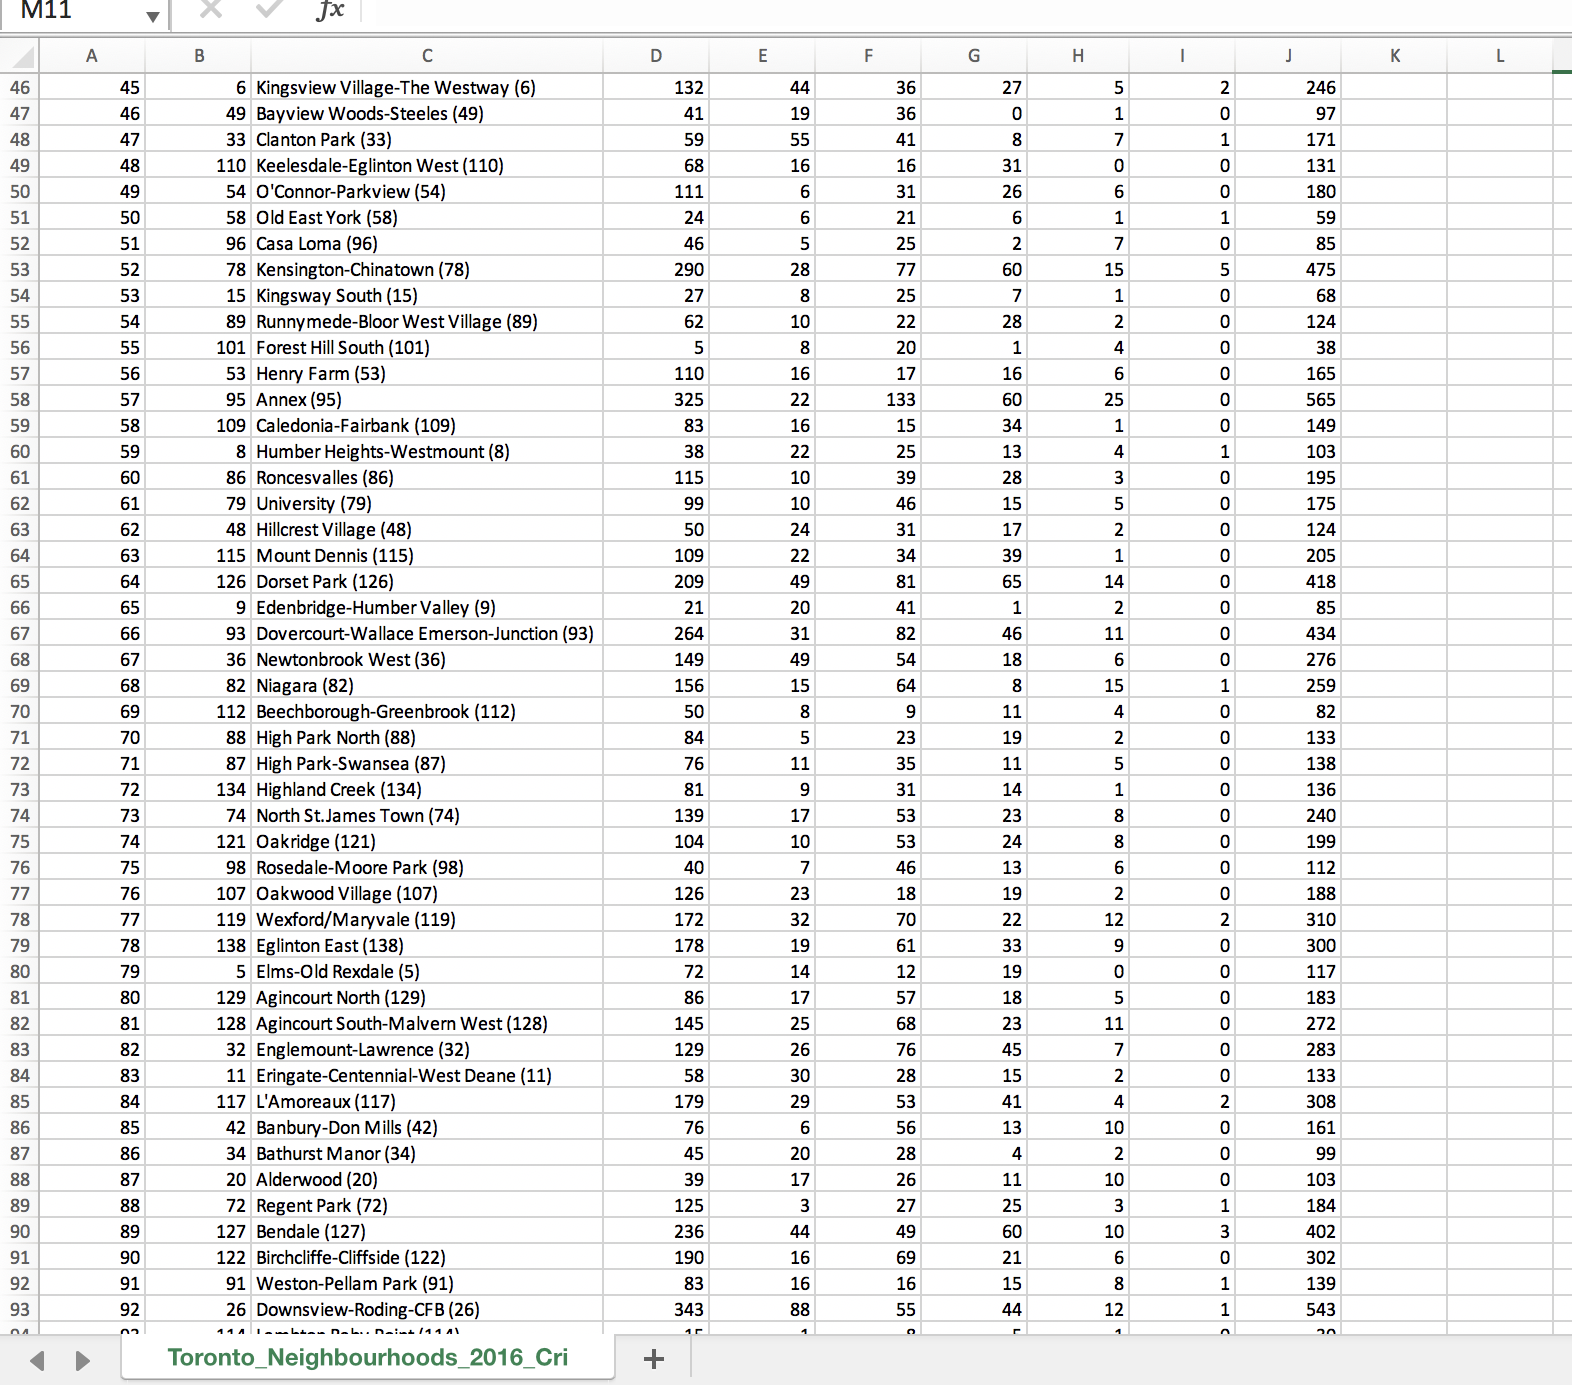
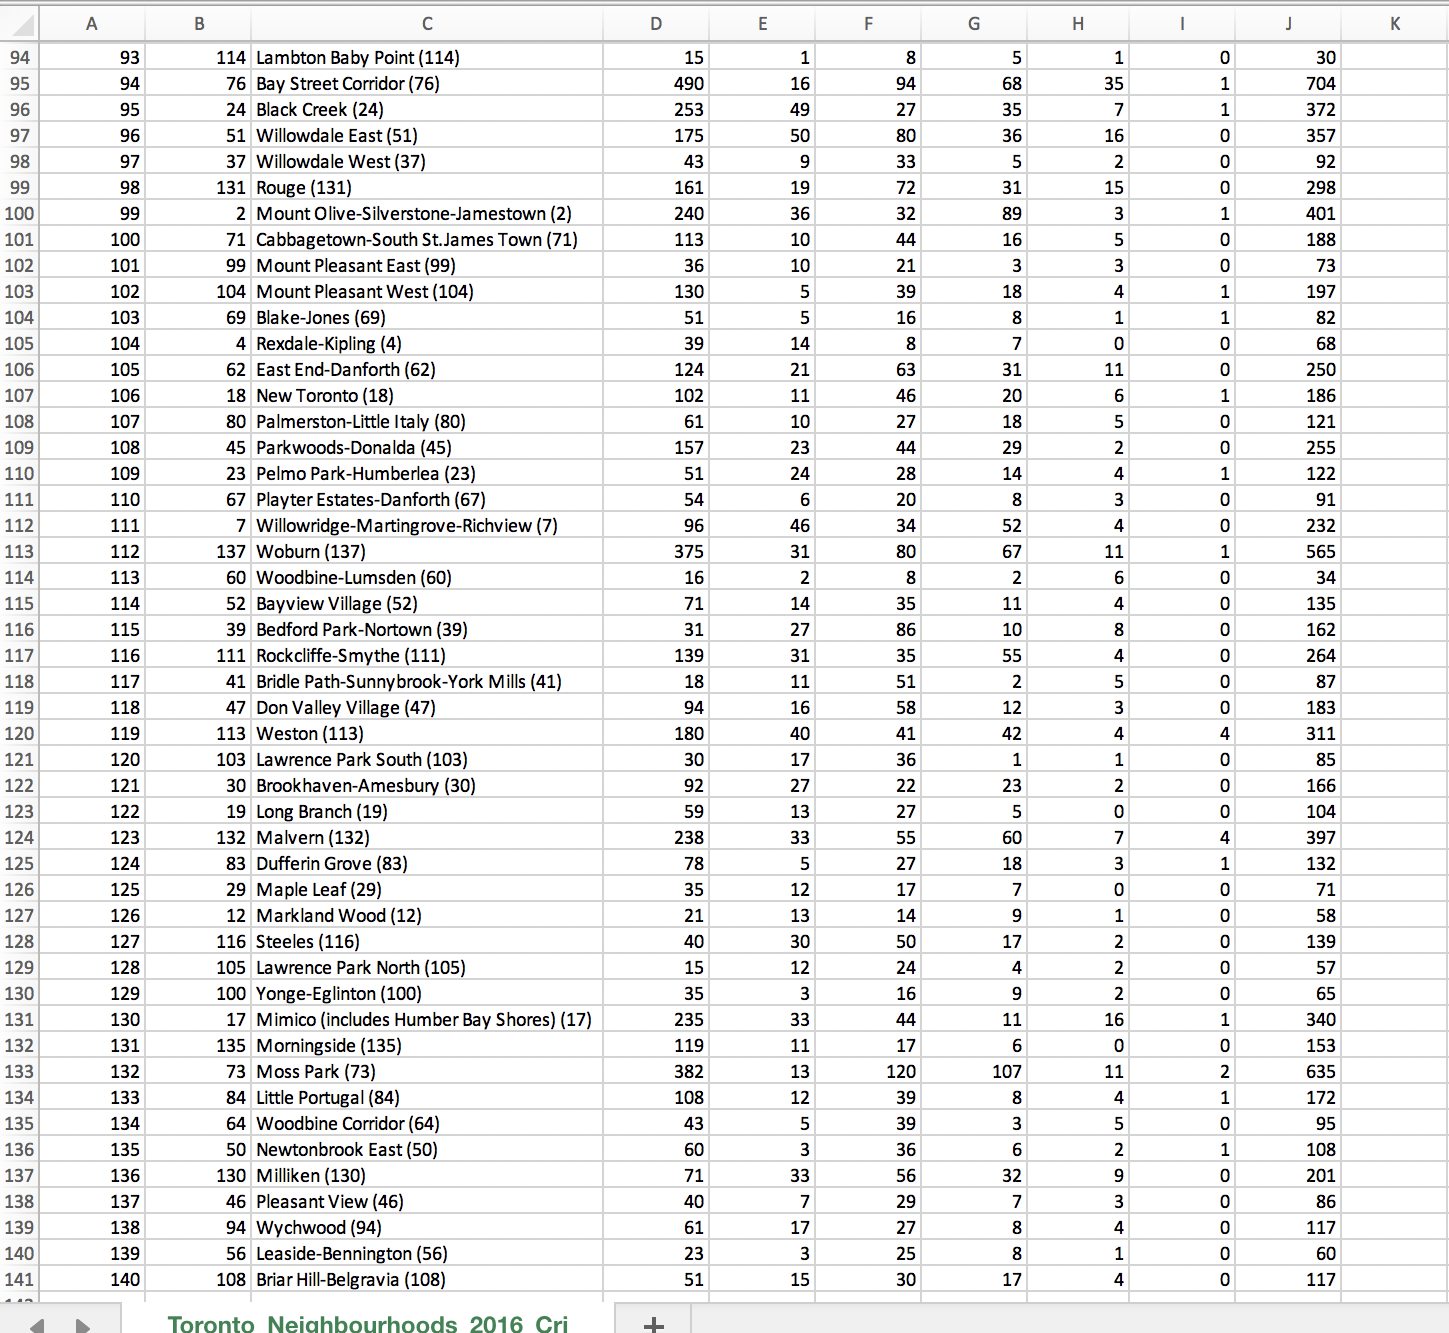
D E G H K A B C Total AREA_S_CD AREA_NAME Assault Auto Theft Break_and_Robbery Theft_Over Homicide ">FID 97 Yonge-St. Clair (97) 20 98 54 97 688 27 York University Heights (27) 372 104 28 47 15 205 38 Lansing-Westgate (38 107 31 Yorkdale-Glen Park (31) 175 41 66 24 333 16 Stonegate-Queensway (16) 81 16 54 19 177 118 Tam O'Shanter-Sullivan (118) 112 28 64 29 242 124 9 99 257 63 The Beaches (63) 22 51 15 24 116 3 Thistletown-Beaumond Heights (3) 152 55 Thorncliffe Park (55) 90 5 29 59 Danforth East York (59) 74 12 50 151 106 Humewood-Cedarvale (106) 65 19 32 133 215 132 530 14 Islington-City Centre West (14) 104 47 214 13 66 Danforth (66) 113 144 14 28 Rustic (28) 96 22 272 15 139 Scarborough Village (139) 195 36 16 241 75 394 85 South Parkdale (85 17 70 South Riverdale (70) 233 30 154 486 10 58 163 18 40 St.Andrew-Windfields (40) 60 131 217 61 Taylor-Massey (61) 46 19 10 21 Humber Summit (21) 147 66 43 301 20 21 22 Humbermede (22) 92 22 180 103 22 133 Centennial Scarborough (133) 56 26 794 180 1239 23 75 Church-Yonge Corridor (75) 341 102 HONOOAOONHOOKOHHHOOOOOOH WOHOHOWHOOHOOOOOOOOHONO 568 24 120 Clairlea-Birchmount (120) 209 25 123 Cliffcrest (123) 110 J J H U A DO F OO N A A H O O N O U A N A W N W W N P H H OO V OF U N H O OO D UI N N W O VO 44 Flemingdon Park (44) 162 14 209 26 27 92 Corso Italia-Davenport (92) 88 16 144 28 125 lonview (125) 79 11 112 107 34 80 29 90 Junction Area (90) 30 view North 48 20 31 32 34 132 10 Princess-Rosethorn (10) 158 32 68 North Riverdale (68) 72 45 51 18 90 33 13 Etobicoke West Mall (13) 34 102 Forest Hill North (102) 20 21 25 Glenfield-Jane Heights (25) 314 30 191 35 67 195 36 65 Greenwood-Coxwell (65) 103 13 62 16 59 37 140 Guildwood (140) 40 59 38 81 Trinity-Bellwoods (81) 245 31 371 43 Victoria Village (43) 124 23 189 39 21 77 Waterfront Communities-The Island (77) 978 46 223 1392 40 42 41 136 West Hill (136) 415 15 586 42 1 West Humber-Clairville (1) 347 338 981 43 26 219 44 43 35 Westminster-Branson (35) 147 17 340 44 231 45 124 Kennedy Park (124) 246 46 6 Kingsview Village-The Westway (6) 132 44 47 49 Bayview Woods-Steeles (49) 41 19 36 46 41 171 48 17 33 Clanton Park (33) 59 55 121 Toronto_Neighbourhoods_2016_Cri +\fC D E F G H K A B 1 8 30 94 93 114 Lambton Baby Point (114) 15 490 16 94 704 95 94 76 Bay Street Corridor (76) 253 372 96 95 24 Black Creek (24) 49 97 96 51 Willowdale East (51) 175 50 357 98 97 37 Willowdale West (37) 43 298 99 98 131 Rouge (131) 161 19 36 101 100 99 2 Mount Olive-Silverstone-Jamestown (2) 240 188 101 100 71 Cabbagetown-South St.James Town (71) 113 102 101 99 Mount Pleasant East (99 36 197 103 102 104 Mount Pleasant West (104) 130 82 104 103 69 Blake-Jones (69) 51 14 68 105 104 4 Rexdale-Kipling (4) 39 124 21 250 106 105 62 East End-Danforth (62) 186 107 106 18 New Toronto (18) 102 11 107 80 Palmerston-Little Italy (80) 61 10 121 108 109 108 45 Parkwoods-Donalda (45) 157 23 255 122 110 109 23 Pelmo Park-Humberlea (23) 51 24 91 110 67 Playter Estates-Danforth (67) 54 6 111 46 111 7 Willowridge-Martingrove-Richview (7) 96 232 112 31 565 113 112 137 Woburn (137) 375 16 IN 34 114 113 60 Woodbine-Lumsden (60) 135 115 114 52 Bayview Village (52 71 14 162 116 115 39 Bedford Park-Nortown (39) 31 116 139 264 O O O O O H O H N O H O O O O O H A O O O A O O O O O O H O O H O O H O O H H O O H O O O H H C A H A WONUAP OO N N N HOW JO NH A WUD DA OH AWANUIOH OH A W OWING VH 117 111 Rockcliffe-Smythe (111) 11 37 118 117 41 Bridle Path-Sunnybrook-York Mills (41) 18 16 183 119 118 47 Don Valley Village (47) 94 119 113 Weston (113 180 311 120 120 17 121 30 85 103 Lawrence Park South (103) 92 27 991 122 121 30 Brookhaven-Amesbury (30) 104 122 19 Long Branch (19) 59 13 123 33 397 124 123 132 Malvern (132) 238 78 5 132 125 124 83 Dufferin Grove (83) 126 125 29 Maple Leaf (29) 35 12 126 arkland Wood (12) 21 13 127 40 30 139 128 127 116 Steeles (116) 57 129 128 105 Lawrence Park North (105) 15 35 65 130 129 100 Yonge-Eglinton (100) 130 17 Mimico (includes Humber Bay Shores) (17) 235 340 131 153 132 131 135 Morningside (135) 119 ;35 133 132 73 Moss Park (73) 382 72 134 133 84 Little Portugal (84) 108 43 95 135 134 64 Woodbine Corridor (64) 108 136 135 50 Newtonbrook East (50) 60 71 201 137 136 130 Milliken (130) 137 46 Pleasant View (46) 40 86 138 117 139 138 94 Wychwood (94) 61 60 140 139 56 Leaside-Bennington (56) 23 117 141 140 108 Briar Hill-Belgravia (108 51 15 s 2016 Cri
Step by Step Solution
There are 3 Steps involved in it

Get step-by-step solutions from verified subject matter experts