

Question: Determine if the data is nominal, ordinal, interval or ratio and explain why. Provide a summary table of variables Age, Total RRSP contributions by each
- Determine if the data is nominal, ordinal, interval or ratio and explain why.
- Provide a summary table of variables Age, Total RRSP contributions by each province. Which year has the highest percentage and lowest percentage for each category?
- Answer the following questions:
- Is this qualitative or quantitative data?
- Is this continuous or discrete data?
- Provide the rationale for your answers.
- Is the sample size appropriate for the data set? Explain why?
- Describe the distribution of the sample's mean for Age and Total RRSP using the central limit theorem.
- Calculate the variance and standard deviation for Age, Total RRSP and Median RRSP contributions for each year province and graph the results. Are the graphs a normal curve, positively skewed or negatively skewed? Explain the results.
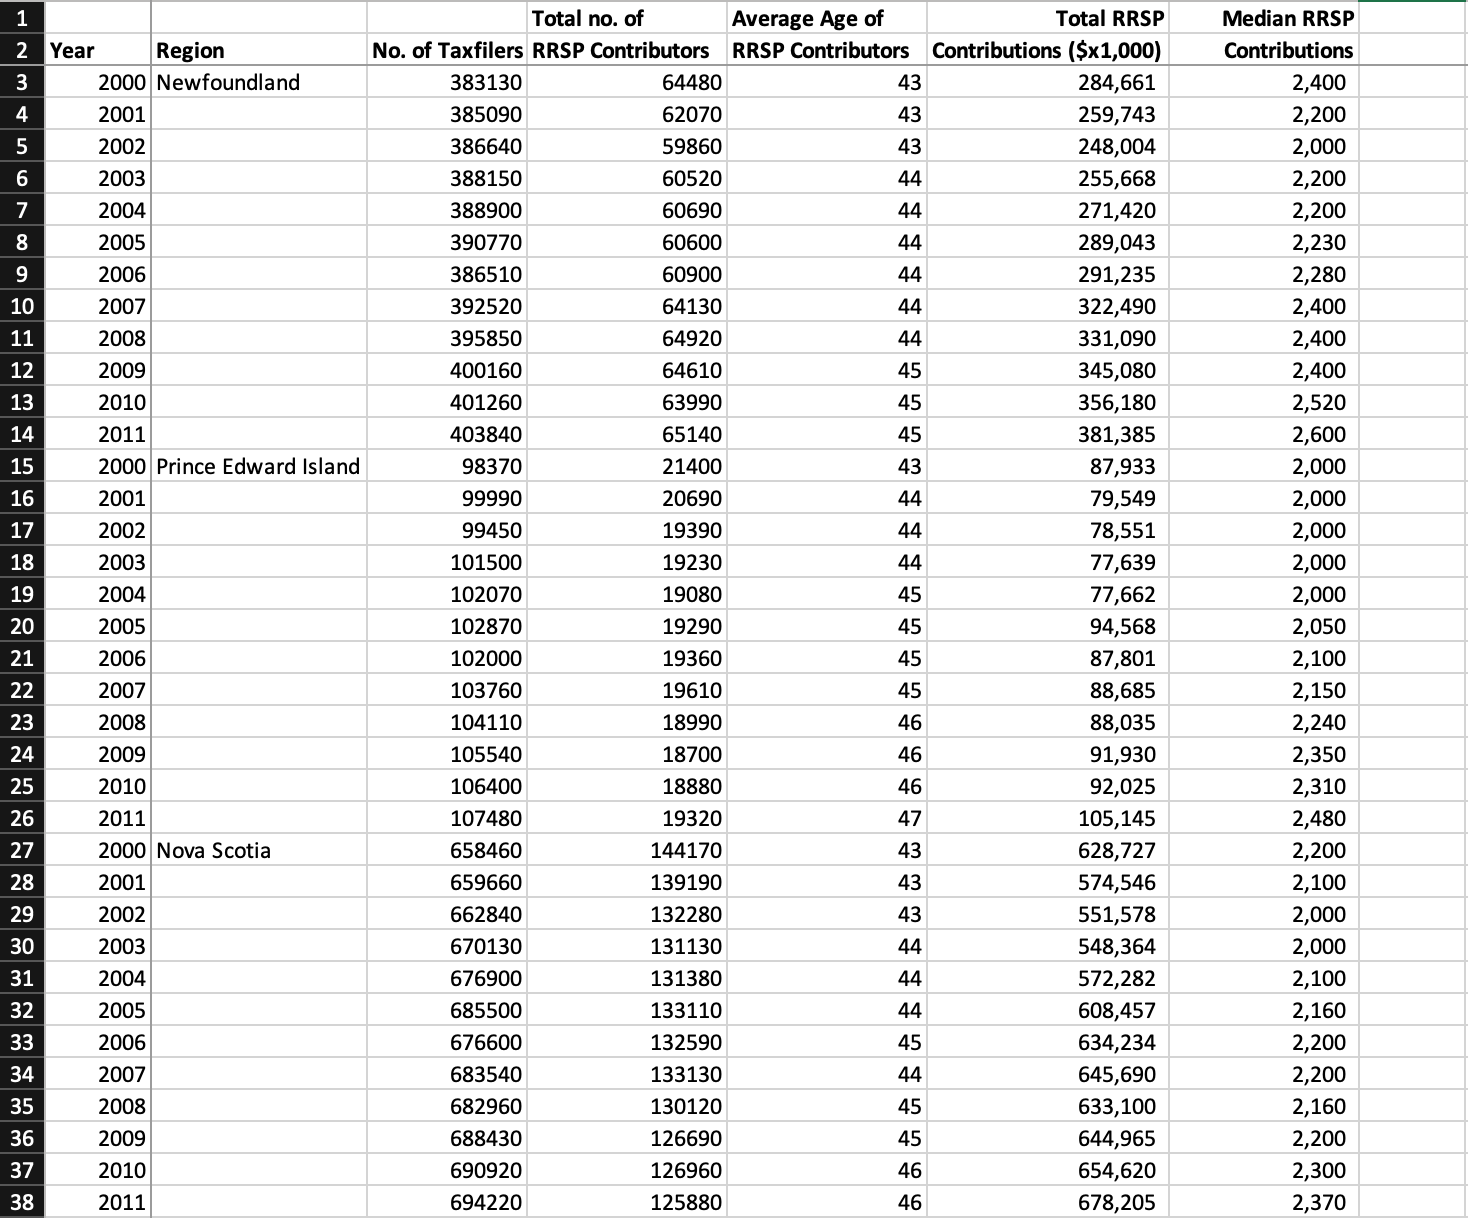

Total no. of Average Age of Total RRSP Median RRSP 2 Year Region No. of Taxfilers RRSP Contributors RRSP Contributors Contributions ($x1,000) Contributions 2000 Newfoundland 383130 64480 43 284,661 2,400 w 2001 385090 62070 43 259,743 2,200 43 248,004 2,000 U 2002 386640 59860 2003 388150 60520 44 255,668 2,200 2004 388900 60690 44 271,420 2,200 2005 390770 60600 44 289,043 2,230 2006 386510 60900 44 291,235 2,280 10 2007 392520 64130 44 322,490 2,400 11 2008 395850 64920 44 331,090 2,400 12 2009 400160 64610 45 345,080 2,400 13 2010 401260 63990 45 356,180 2,520 14 2011 403840 65140 45 381,385 2,600 15 2000 Prince Edward Island 98370 21400 43 87,933 2,000 16 2001 99990 20690 44 79,549 2,000 17 2002 99450 19390 44 78,551 2,000 18 2003 101500 19230 44 77,639 2,000 19 2004 102070 19080 45 77,662 2,000 20 2005 102870 19290 45 94,568 2,050 21 2006 102000 19360 45 87,801 2,100 22 2007 103760 19610 45 88,685 2,150 23 2008 104110 18990 46 88,035 2,240 24 2009 105540 18700 46 91,930 2,350 25 2010 106400 18880 46 92,025 2,310 26 2011 107480 19320 47 105,145 2,480 27 2000 Nova Scotia 658460 144170 43 628,727 2,200 28 2001 659660 139190 43 574,546 2,100 29 2002 662840 132280 43 551,578 2,000 30 2003 670130 131130 44 548,364 2,000 31 2004 676900 131380 44 572,282 2,100 32 2005 685500 133110 44 608,457 2,160 33 2006 676600 132590 45 634,234 2,200 34 2007 683540 133130 44 645,690 2,200 35 2008 682960 130120 45 633,100 2,160 36 2009 688430 126690 45 644,965 2,200 37 2010 690920 126960 46 654,620 2,300 38 2011 694220 125880 46 678,205 2,370\f
Step by Step Solution
There are 3 Steps involved in it

Get step-by-step solutions from verified subject matter experts