

Question: 1.Draw a scatter diagram for the data shown above. Submit in Word or a picture file. 2.Is there a relationship between permeability and carbon content?
1.Draw a scatter diagram for the data shown above. Submit in Word or a picture file.
2.Is there a relationship between permeability and carbon content?
3.If low permeability is desirable, what does the scatter diagram suggest regarding the carbon content?
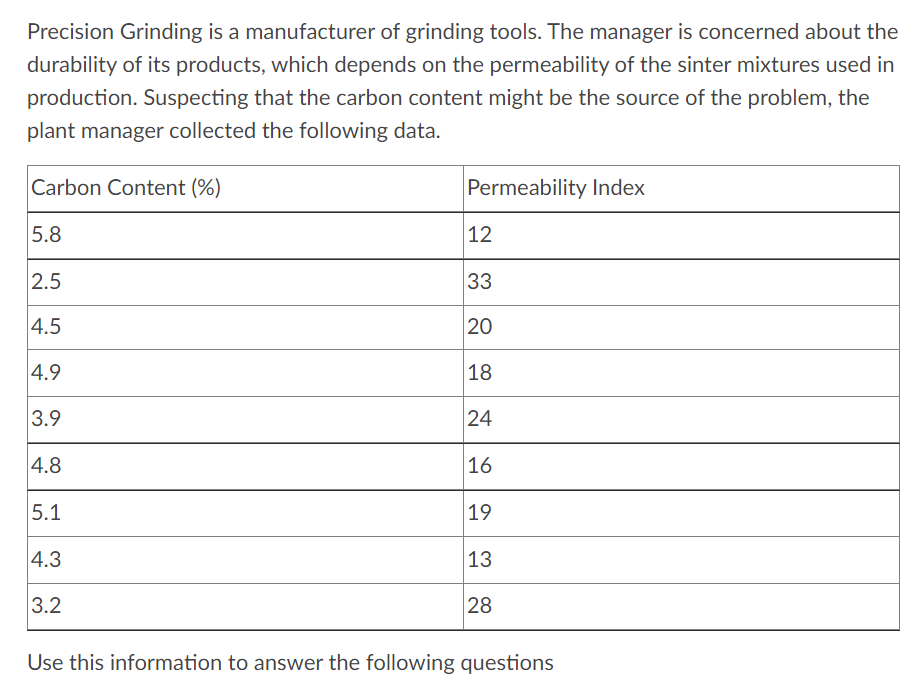
Precision Grinding is a manufacturer of grinding tools. The manager is concerned about the durability of its products, which depends on the permeability of the sinter mixtures used in production. Suspecting that the carbon content might be the source of the problem, the plant manager collected the following data. Carbon Content (%) Permeability Index 5.8 12 2.5 33 4.5 20 4.9 18 3.9 24 4.8 16 5.1 19 4.3 13 3.2 28 Use this information to answer the following questionsStep by Step Solution
There are 3 Steps involved in it
1 Expert Approved Answer
Step: 1 Unlock

Question Has Been Solved by an Expert!
Get step-by-step solutions from verified subject matter experts
Step: 2 Unlock
Step: 3 Unlock