

Question: please helpp please help please help - thank you ebservetion gives the arrival time (measured in minutes before 6pm ) and the shepping time (measured
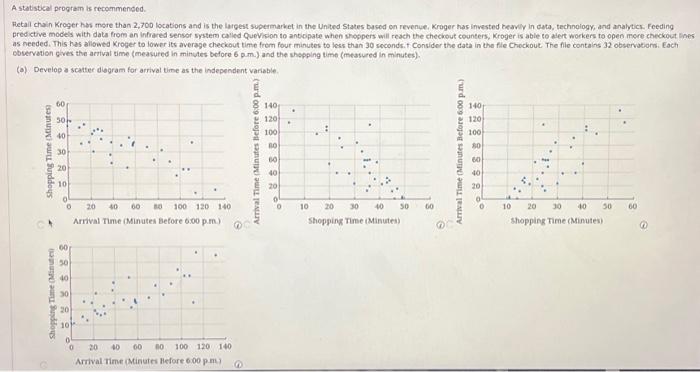
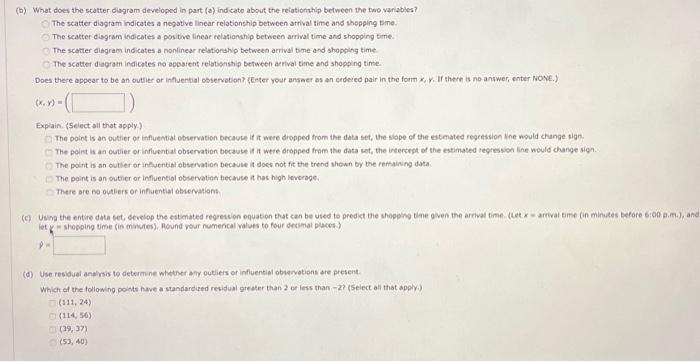
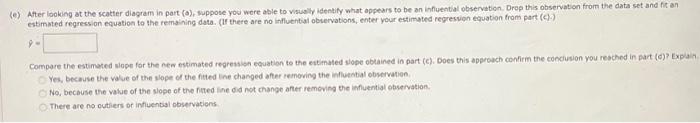
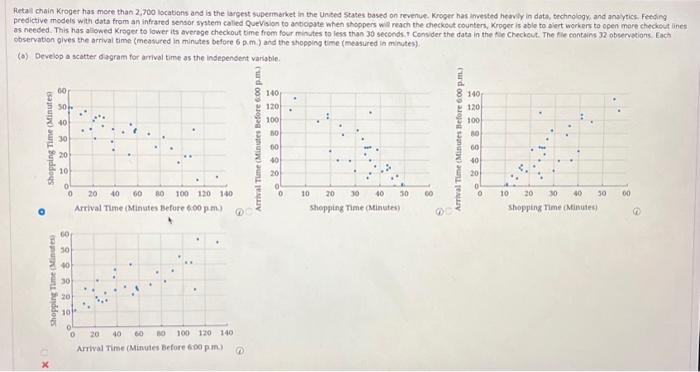
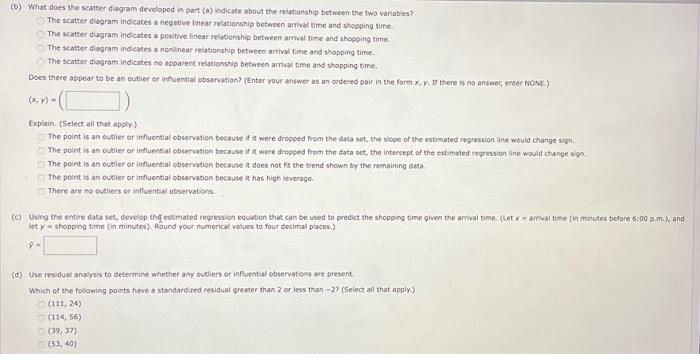
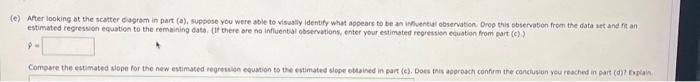
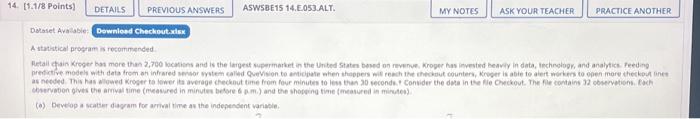
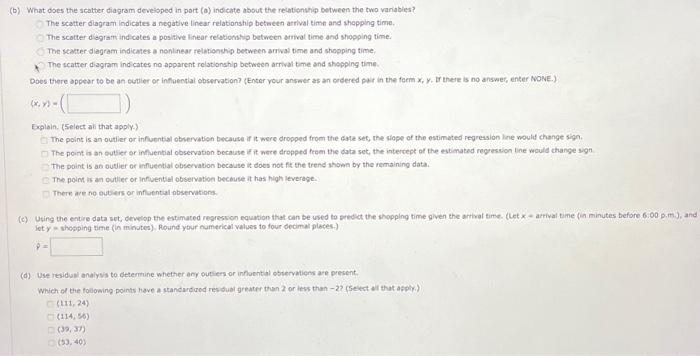
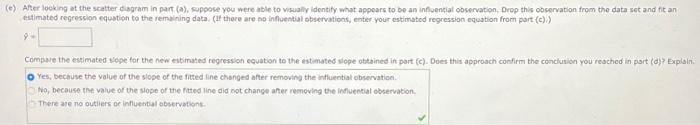
ebservetion gives the arrival time (measured in minutes before 6pm ) and the shepping time (measured in minutes). (a) Develop a scatter diggam for arrival time as the independent variable. (b) What does the scatter dopram developed in part (a) indicate about the relationztip between the two variables? The scatter diagram indicates a nesotive linear relationship between arrival time and shopping pine. The scatter disgram indicates a positive tinear relationahip between arrival time and shopping time. The scatter diagram indicates a nonlinear relationahp between artival bme and shopping time The scatter diagratr indicates no aposent relatsoship betwoen arival time and shopping time. Does there appear to be an outsier or infuential observotion? (Enter yout ansaer as an erdeied pair in the form x,y. If there is no answer, enter Nove.) (x,y)=() Explain. (Seiect all that apply) The point is an outier of influenval observation because if it were dropped from the data set, the slope of the estemated regression ine would change sign. The point is an ovier or influential observation because it it were dropped from the data set, the intercept of the estimated tegresson line would change sign. The point is an outler of influentibl obsevation bectuse it does not fit the trend shown by the remsining data. The point is an outier or influential observation because a has high leverage. There bre no outliers or influential obiervation. let k = shopping time (in mantes), Bound your numencal values to four decsmal pucess) (9) Use resioval and/ris to determine whither any outiess or influential observations bre present. Which of the following points heve a sundardized resifual grepter than 2 or less than -27 (Select all thot appir) (111,24) (114,56) (39,37) (53,40) (e) After looking at the scatter diagram in port (a), wuppose you were able to vasully identify what appears to be an influential observation. Drop this observation from the data set and fit an estimated regression equation to the remaining data. (Ir there are no influential observations, enter your estimated regresugn equation from part (C) = Compare the estimated slope for the neer estimated regression equation to the eztimated slope obtained in part (C). Does this approach confirm the conciusion you reached in part (f)? Explat Yes, because the value of the slope of the fitted the changed after renoring the inluential observation: No, because the value of the slope of the fited line did not change antr remevima the imfuential observation There are no outliens of infuential observacions as needed. This has aliowed Kroger to lower its averege checkout time from four minutes to less than 30 seconds, Consider the data in the fie Checkeut. The file contains 32 obervesions. Each. observation gives the arrival time (measured in minutes before 6p.m ) and the shopoing time (measured in minutes). (o) Develsp a scatter dagram for arrival time as the indepensent varisbic. (b) What does the scatter diagram developed in part (0) indicete about the relstionship between the two variables? The scatter diagram indicates a negative linear rejationship between arfival time and shopping time. The scatter diagram indicates a pesitive linear relationship between amwat time and shopping time. The scatter dsgram indicates a nonlinear relationship between arrivel time and shopping time. The scatter diagram indicates no apparent reationship between arrival time and shopping time. Does there appear to be an outier or inhuential observation? (Enter your answer as an ordered pair in the form x,y, If there is na answec, eneer Nove,\} (x,y)=() Explein: (Select all that apply.) The point is an outlier or influential observation becouse if is were decpped from the data set, the slope of the estimated regression ine would change sign. The point is an outlier or influential observation because if it were deopesd from the data set, the intercept af the estimeted regression ine would chenge siga The point is an outier or influential observation because a does not ft the trend shown by the remaining bata The point is an outler or influential observation because at has high leveroge. There ace no ouliers or influental observations. let y a shopping time (in minutes). Round your numerical values to four decimal places.) (d) Use residual analysis to determine whether any oudiers or infiuential observations are present, Which of the following points have a standardired tesiduat greater than 2 or less than -27 (Seiect ail that apply) (111,24) (114,56) (39,37) (53,40) estimated regreseon equation to the remaining data. (It there are na infuental observations, enter your estimated regressien equation from part (c) ?) = A statistical proterm is recommended. (a) Develop a scatier dacpam for artival time as the independent variapie. (b) What does the scatter diagram deveioped in part (a) indicate about the relationship between the two vanabies? The scatter dagram indicates a negative linear relationship betwetn atrival timn and shopping time. The scatter d agram indicates a positive linear relationsho between arrval time and shopping time. The scatter diagram indicates a nonl near retahionsip between arnval time and shopping time; The scatter diagram ind cates no apparent relationship between arrival bme and shopping time. Obes there oppear to be an euvler or influential observation? (Enter vour ansatr as an crdered pair in the form x,y. If there is no answer, enter NoNE.) (x,y)=( Explain. (5elect ain that apply.) The point is an outlier or infuential observation because if it were dropped from the date set, the sigpe of the estimeted regreasion line would change sign. The point is an butier or influential observation because if it were dropped feom the data set, the intercept of the estimated regreskion ine would change sign The point is as outier or imflueetial observation because it does not fis the trend shown by the remiaining data. The point is an outlec or Infiuential observation beceuse it has high leverage. There are no outers or infuential abservations. let y= shogping time (in minutes). Round your numerical values to four decimal places.) P= (d) Use residial analysis to getermine whether any outiers or infloental ebtervatiens are present. Which of the folowing points have a standardiod resdual greater than 2 or less than -27 (Select al that afply.) (111,24) (114,5) (32,37) (53,40) (e) After looking at the scatter disgram in part (a), suppose you were able to visually identify what appoars to be an influenciat observation, Drop this observation from the data set and fit an estimated regression equation to the remaining data. (If there are no influential observations, enter your estimatod regression equation from part (c),) 9= Compare the essimated vope for the new etbinated regression equation to the estimated slope obtained in port (c). Does this approach confirm the conclusion you reached in port (d)) Explain. Yes, bechuse the value of the slope of the fitted line changed after removing the influential observation. No, because the value of the slope of the fitted line did not change anter removing the influential observation. There are no outliers or influential observations. ebservetion gives the arrival time (measured in minutes before 6pm ) and the shepping time (measured in minutes). (a) Develop a scatter diggam for arrival time as the independent variable. (b) What does the scatter dopram developed in part (a) indicate about the relationztip between the two variables? The scatter diagram indicates a nesotive linear relationship between arrival time and shopping pine. The scatter disgram indicates a positive tinear relationahip between arrival time and shopping time. The scatter diagram indicates a nonlinear relationahp between artival bme and shopping time The scatter diagratr indicates no aposent relatsoship betwoen arival time and shopping time. Does there appear to be an outsier or infuential observotion? (Enter yout ansaer as an erdeied pair in the form x,y. If there is no answer, enter Nove.) (x,y)=() Explain. (Seiect all that apply) The point is an outier of influenval observation because if it were dropped from the data set, the slope of the estemated regression ine would change sign. The point is an ovier or influential observation because it it were dropped from the data set, the intercept of the estimated tegresson line would change sign. The point is an outler of influentibl obsevation bectuse it does not fit the trend shown by the remsining data. The point is an outier or influential observation because a has high leverage. There bre no outliers or influential obiervation. let k = shopping time (in mantes), Bound your numencal values to four decsmal pucess) (9) Use resioval and/ris to determine whither any outiess or influential observations bre present. Which of the following points heve a sundardized resifual grepter than 2 or less than -27 (Select all thot appir) (111,24) (114,56) (39,37) (53,40) (e) After looking at the scatter diagram in port (a), wuppose you were able to vasully identify what appears to be an influential observation. Drop this observation from the data set and fit an estimated regression equation to the remaining data. (Ir there are no influential observations, enter your estimated regresugn equation from part (C) = Compare the estimated slope for the neer estimated regression equation to the eztimated slope obtained in part (C). Does this approach confirm the conciusion you reached in part (f)? Explat Yes, because the value of the slope of the fitted the changed after renoring the inluential observation: No, because the value of the slope of the fited line did not change antr remevima the imfuential observation There are no outliens of infuential observacions as needed. This has aliowed Kroger to lower its averege checkout time from four minutes to less than 30 seconds, Consider the data in the fie Checkeut. The file contains 32 obervesions. Each. observation gives the arrival time (measured in minutes before 6p.m ) and the shopoing time (measured in minutes). (o) Develsp a scatter dagram for arrival time as the indepensent varisbic. (b) What does the scatter diagram developed in part (0) indicete about the relstionship between the two variables? The scatter diagram indicates a negative linear rejationship between arfival time and shopping time. The scatter diagram indicates a pesitive linear relationship between amwat time and shopping time. The scatter dsgram indicates a nonlinear relationship between arrivel time and shopping time. The scatter diagram indicates no apparent reationship between arrival time and shopping time. Does there appear to be an outier or inhuential observation? (Enter your answer as an ordered pair in the form x,y, If there is na answec, eneer Nove,\} (x,y)=() Explein: (Select all that apply.) The point is an outlier or influential observation becouse if is were decpped from the data set, the slope of the estimated regression ine would change sign. The point is an outlier or influential observation because if it were deopesd from the data set, the intercept af the estimeted regression ine would chenge siga The point is an outier or influential observation because a does not ft the trend shown by the remaining bata The point is an outler or influential observation because at has high leveroge. There ace no ouliers or influental observations. let y a shopping time (in minutes). Round your numerical values to four decimal places.) (d) Use residual analysis to determine whether any oudiers or infiuential observations are present, Which of the following points have a standardired tesiduat greater than 2 or less than -27 (Seiect ail that apply) (111,24) (114,56) (39,37) (53,40) estimated regreseon equation to the remaining data. (It there are na infuental observations, enter your estimated regressien equation from part (c) ?) = A statistical proterm is recommended. (a) Develop a scatier dacpam for artival time as the independent variapie. (b) What does the scatter diagram deveioped in part (a) indicate about the relationship between the two vanabies? The scatter dagram indicates a negative linear relationship betwetn atrival timn and shopping time. The scatter d agram indicates a positive linear relationsho between arrval time and shopping time. The scatter diagram indicates a nonl near retahionsip between arnval time and shopping time; The scatter diagram ind cates no apparent relationship between arrival bme and shopping time. Obes there oppear to be an euvler or influential observation? (Enter vour ansatr as an crdered pair in the form x,y. If there is no answer, enter NoNE.) (x,y)=( Explain. (5elect ain that apply.) The point is an outlier or infuential observation because if it were dropped from the date set, the sigpe of the estimeted regreasion line would change sign. The point is an butier or influential observation because if it were dropped feom the data set, the intercept of the estimated regreskion ine would change sign The point is as outier or imflueetial observation because it does not fis the trend shown by the remiaining data. The point is an outlec or Infiuential observation beceuse it has high leverage. There are no outers or infuential abservations. let y= shogping time (in minutes). Round your numerical values to four decimal places.) P= (d) Use residial analysis to getermine whether any outiers or infloental ebtervatiens are present. Which of the folowing points have a standardiod resdual greater than 2 or less than -27 (Select al that afply.) (111,24) (114,5) (32,37) (53,40) (e) After looking at the scatter disgram in part (a), suppose you were able to visually identify what appoars to be an influenciat observation, Drop this observation from the data set and fit an estimated regression equation to the remaining data. (If there are no influential observations, enter your estimatod regression equation from part (c),) 9= Compare the essimated vope for the new etbinated regression equation to the estimated slope obtained in port (c). Does this approach confirm the conclusion you reached in port (d)) Explain. Yes, bechuse the value of the slope of the fitted line changed after removing the influential observation. No, because the value of the slope of the fitted line did not change anter removing the influential observation. There are no outliers or influential observations
Step by Step Solution
There are 3 Steps involved in it

Get step-by-step solutions from verified subject matter experts