

Question: 1)Identify the cash flow patterns for 2020 and 2019. What do these patterns tell us about Loblaw? 2)Calculate the average age percentage of Loblaws property
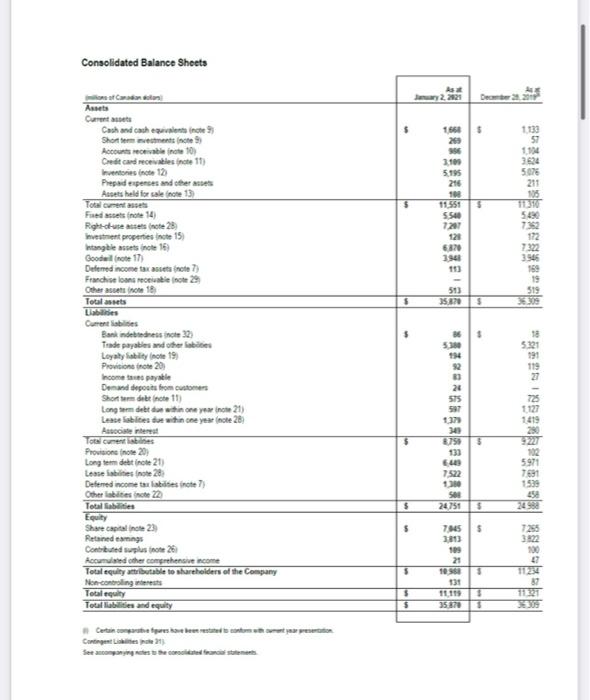
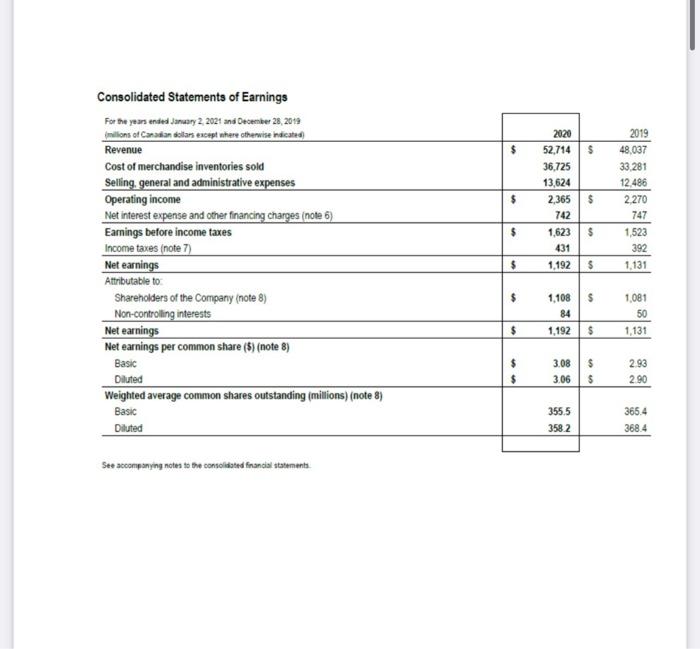
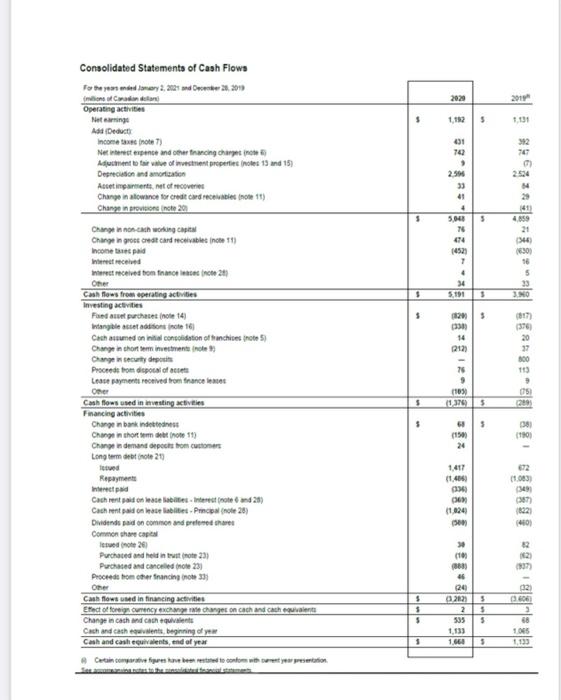

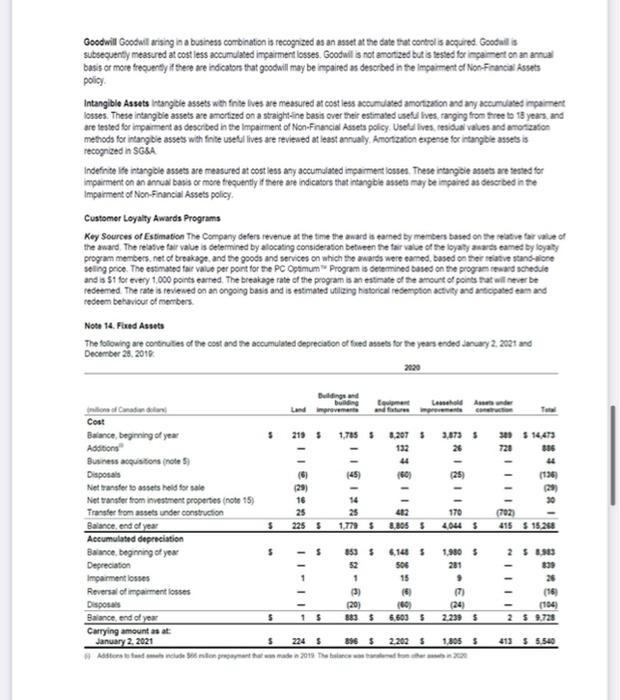
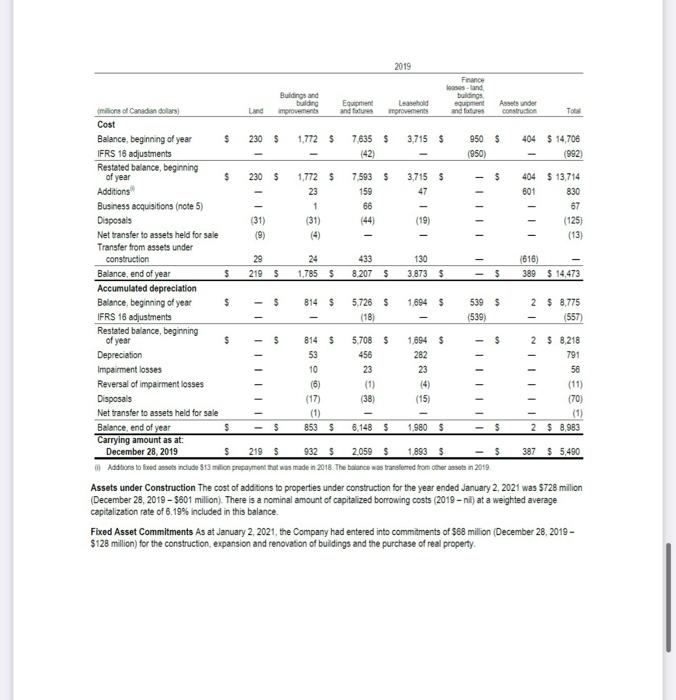
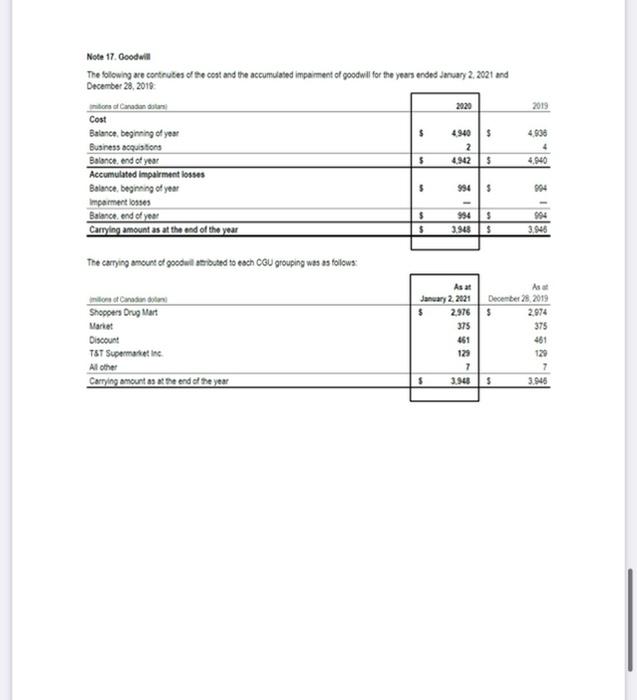
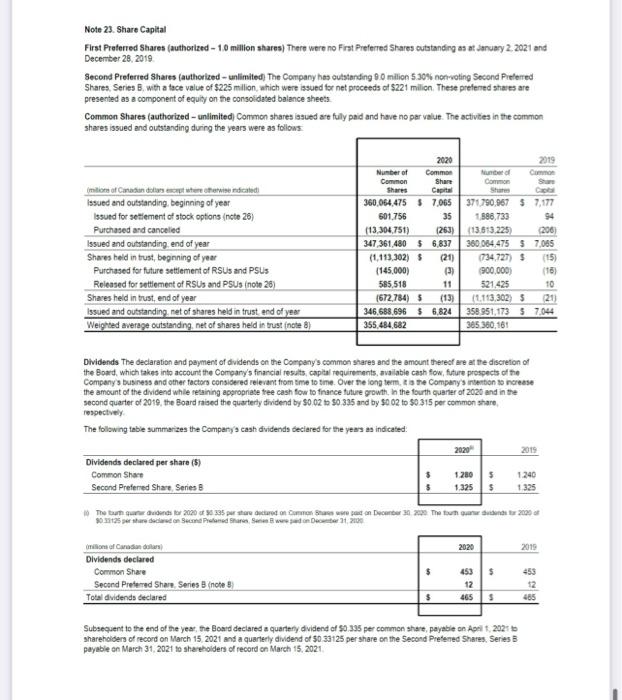
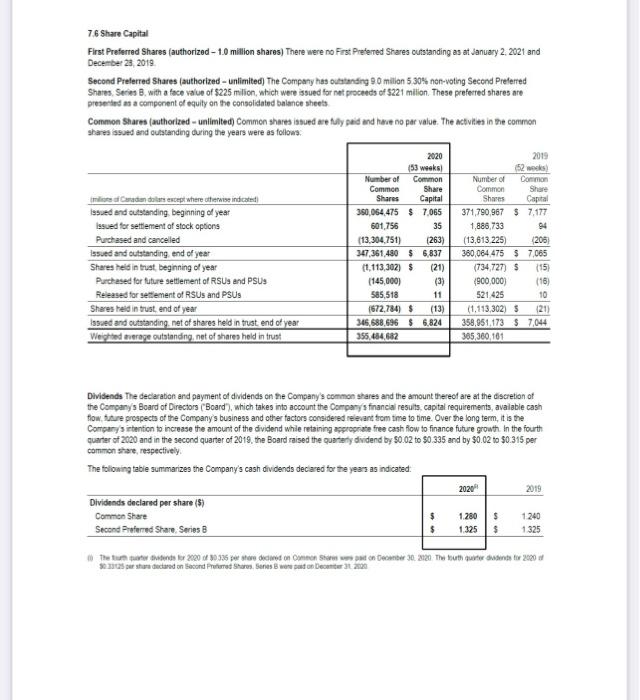
Consolidated Balance Sheets wy2.2121 1660 $ 20 3.100 5.195 216 100 11551 5540 7201 121 6820 3941 1133 57 1.14 3.634 5074 211 106 11310 5490 7362 172 7322 3.546 513 35.870 169 19 519 3309 $ 5 of Canada.com Assets Current Cash and cachentine Short term went inte Accounts receivable note 10) Credit Card reablete 11) Inventories incte 12 Prepaid expenses and others Assets held for sale ore 13) Totalmente Fredet for 14 Right note 28) Investment propertieste 15) Intangible sente 16 Goodall note 17 Deemed income taxe note 7) Franchise lansate 29 Other set 18 Total assets Les Current Bank indebtednessine 32 Teade payables and other babies Loyalty liability note 19 Prowione note 20 Income pale Demand depots from customers Short dette11) Long term deb do within one yerine 21) Lease abities or within one you note 28 Associate interest To Curenti Provisione none 20) Long term det inte 21) Losse bites note28 Deemed income talebites inte? Other abilities note 2 Total abities Equity Share capitalinote 23 Rendang Contributed Surplus note 26 Acorded the core come Total equity attributable to shareholders of the Company Non-controlling Total guilty Total liabilities and equity 86 5.380 14 18 5.121 191 27 24 575 597 137 30 875 1419 230 $ $ 130 EL 7.522 102 5971 7691 1539 252 24558 $ 500 24.751 $ $ 7.15 3:13 109 21 100 7255 3822 100 2 11 87 5 $ 3 $ $ 11119 35.870 Certain cours de resteren Contingentes pole $ $ 2020 52.714 36,725 13,624 2,365 742 1,623 431 1,192 $ $ Consolidated Statements of Earnings For the year ended January 2 2021 and December 28, 2018 millions of Canadian dollars except where otherwise indicated Revenue Cost of merchandise inventories sold Selling, general and administrative expenses Operating income Net interest expense and other financing charges (note 6) Earnings before income taxes Income taxes (note 7) Net earnings Attributable to Shareholders of the Company (note 8) Non-controlling interests Net earnings Net earnings per common share (5) (note 8) Basic Diluted Weighted average common shares outstanding (millions) (note 8) Basic Diluted 2019 48,037 33.281 12.486 2270 747 1,523 392 1.131 $ $ $ $ $ $ 1,108 84 1,192 1,081 50 1,131 $ $ $ 3.08 3.06 $ $ 2.93 2.90 3555 365.4 3684 3582 See accompanying notes to the consolidated financial statements 2020 2014 5 Consolidated Statements of Cash Flows For the penned my 2, 2012 december 28, 2011 (millions of Color Operating activities Neting Add Deducts Income taxe note Nettepense and other financing charge Adjustment to be wie of veren properties notes 19 and 15) Depreciation and Acetiments et covered Change in allowance for credit card recruited (note 11) Change in prostor (note 20 2.54 14 491 74 9 2.500 33 41 4 5.040 70 474 14523 7 4 34 5.191 41 4359 3 Change in one woning Capital Change in groot credit card cables inte11) Incontre paid 344 16301 16 5 33 3.NO 5 20 $ 14 012 Interest received to that note 21 Oher Cash flows from operating activities Investing activities Foeduse purchase note 14 Intangible asset to note 16) Cathassumed on initial consolidation of franchise note 5) Change in the investment Changendo Proceeds from disposal of iets Lease payments received from finance fees Oner Cash flows used in investing activities Financing activities Changenbandes Change in short term die note 11) Changinderat potom customers Long tim denote 20 (617) (376 20 37 800 113 2 05 76 9 (1030 10376 $ $ $ $ 6 (151 24 381 11801 1.417 11.400 034 06 (1024 500 672 (1.003 3491 387 8221 4801 82 Repayments Intrepid Cach rent dont le rote and 28) Cach rentadon labelsbe. Pro note 28) Dividends on common and preferred that Common share capital Isted note 26 Purchased and held in tirote 23) Purchased and could note 23 Proceed to the facing note 33 Other Cash flows used in financing activities Efect of foreign currency exchange rate changes on cach and cach equivalent Change in cash and can events Cach and cathet, beginning of you Cash and cash equivalents, end of year 337 $ 5 5 101 380 46 24 2021 2 535 1.133 1.666 5 5 5 3606 3 68 1005 1,133 5 Certain converse breed to conform wheresentation Changes in the Company s operations in response to COVID-19 could materially impact financial results and may include temporary closures of facilities, temporary or long-term labour shortages or disruptions temporary or long-term impacts on supply chains and darbution channels, temporary or long-term restrictions on cross-border commerce and wave including mandatory quarantine periods, greater currency volatility, and increased risics to IT systems, networks and digital services. In addition, the COVID-19 pandemic has changed consumer behaviours and accelerated the advancement of disruptve technologies and has resulted in a significant increase in commerce competition The Company sinability to keep up with the pace of such behavioural changes or technological advancements or with its competitors could adversely affect the contpany's operations or financial performance. The Company's performance may also be affected by the avalability and efficacy of vaccines and the effectiveness of plans to administer those vaccines across the country The spread of COVID-19 has caused an economic slowdown and increased volatility in fnancial markets. Governments and central banks have responded with monetary and fiscal interventions intended to stabilize economic conditions. Although the ultimate impact of COVID-19 on the global economy and its duration remains uncertain, disruptions caused by COVID-19 may adversely affect the performance of the Company Uncertain economic conditions resulting from the COVID-19 pandemic may, in the short or long term, adversely impact operations and the financial performance of the Company, including by adversely impacting demand for certain of the Company's products and services and or the debt and equitymarkets Governmental interventions aimed at containing COVID-19 could also impact the Company's available Workforce to supply chain and distribution channels, the products and services it is able to offer and or its ability to engage in cross-borde commerce 12.1 Operating Risks and Risk Management The following risks are a subset of the key risks dentified through the ERM program. They should be read in conjunction with the set of nisks inherent in the Company's business, as included in the Company's AIF for the year ended January 2, 2021, which is is hereby incorporated by reference Cybersecurity. Privacy and Date Breaches Inventory Management Electronic Commerce and Disruptive Technologies Govemance Change Management Process and Efficiency Competitive Environment and Strategy Service Providers Healthcare Reform Employee Attraction Development and Succession Planning IT Systems implementations and Data Management Economic Conditions Distribution and Supply Chain Franchise Relationships Labour Relations Associate-owned Drug Store Network and Relationships with Associates Food, Drug. Product and Services Safety Regulatory Compliance Legal Proceedings 14.2 Inventories Key Sources of Estimation Inventories are carried at the lower of cost and net realizable value which requires the Company to utilize estimates related to fuctuations in shrink, future retal prices. The impact of vendor rebates on cost seasonality and costs necessary to sel the inventory 14.4 Customer Loyalty Awards Programs Key Sources of Estimation The Company defees revenue at the time the award is earned by members based on the relative far value of the award. The relative fair value is determined by a locating consideration between the fair value of the loyalty awards earned by loyalty program members, net of breakage, and the goods and services on which the awards were earned, based on their relative stand-alone seling price. The estimated far value per point for the PC Optimur Program is determined based on the program reward schedule and is $1 for every 1,000 points earned. The breakage rate of the program is an estimate of the amount of points that will never be redeemed The rate is reviewed on an ongoing basis and is estimated utilizing historical redemption activity and anticipated eam and redeem behaviour of members Notes to the Consolidated Financial Statements For the years ended January 2, 2021 and December 28, 2019 millions of Canadan dollars except where otherwise indicated) Note 1. Nature and Description of the Reporting Entity Loblaw Companies Limited is a Canadian public company incorporated in 1956 and is Canada's food and pharmacy leader and the nation's largest retailer. Loblaw Companies Limited provides Canadians with grocery, pharmacy, health and beauty , apparel general merchandise, financial services, and wireless mobile products and services. Its registered office is located at 22 St Clair Avenue East Toronto, Canada M4T 257. Loblaw Companies Limited and its subsidiaries are together referred to in these consolidated financial statements, as the "Company" or "Loblaw The Company's controlling shareholder is George Weston Limited ("Weston"), which owns approximately 52.8% of the Company's outstanding common shares. The Companys ultimate parent is Willington Investments, Limited (Witington"). The remaining common shares are widely held The Company has two reportable operating segments: Retail and Financial Services (see note 34). Since the first quarter of 2020, the COVID-19 pandemic has had a significant impact on the Company. The Company's financial results for the year ended January 2 2021 show increased revenue, driven by increased demand for the Company's products, as well as increased cost of merchandise inventories sold. In addition, seling general and administrative expenses (SG&A) also increased as a result of the incremental cost of COVID-19 related investments to benefit and protect colleagues and customers. Note 2. Significant Accounting Policies Fiscal Year The fiscal year of the Company ends on the Saturday closest to December 31. Under an accounting convention common in the retail industry, the Company follows a 52-week reporting cycle, which periodicaly necessitates a fiscal year of 53 weeks. The year ended January 2, 2021 contained 53 weeks and the year ended December 28, 2019 contained 52 weeks. Net Earnings per Common Share Basic net earings per common share ("EPS) is calculated by dividing the net earnings available to common shareholders by the weighted average number of common shares outstanding during the penod, Diluted EPS is calculated by adjusting the net earnings available to common shareholders and the weighted average number of common shares outstanding for of the effects of all dilutive instruments Revenue Recognition The Company recognizes revenue when control of the goods or services has been transferred. Revenue is measured at the amount of consideration to which the Company expects to be entitled to, nuding variable consideration to the extent that it is highly probable that a significant reversal will not occur Retail Retail segment revenue includes the sale of goods and services to customers through corporate stores and consolidated franchise stores and Associates, and sales to non consolidated franchise stores and independent wholesale account customers. Revenue is measured at the amount of consideration to which the Company expects to be entitled to, net of estimated retums, sales incentives and franchise fee reductions. The company recognizes revenue made through corporate stores, consolidated franchise stores and Associates at the time the point of sales made or when service is delivered to the customers. The company recognizes revenue made through non consolidated franchise stores and independent wholesale customers at the time of delvery of inventory and when administrative and management Services are rendered On the intai sale of franchising an angements, the Company offered products and services as part of an arrangement with multiple performance obligations. Prior to the implementation of the Franchise Agreement. The initial sale to non consolidated franchise stores were recorded using a relative fair value approach Customer loyalty awards are accounted for as a separate performance obligation of the sales transaction in which they are granted. The Company defers revenue at the time the ward is earned by members based on the relative far value of them. The relative fair value is determined by allocating consideration between the fair value of the loyalty awards earned by loyalty program members, net of breakage, and the goods and services on which the awards were earned based on their relative standalone selling price For certain sale of goods in which the Company ears commissions, including but not limited to lottery and the party gift cards, the Company records net revenue as an agent on the basis that the Company does not control pricing or bear inventory tisk Financial Services France Services revenue includes interest income on credit card loans, credit card service fees commissions and other revenue related to financial services interest income is recognized using the effective interest method Credit Card Service fees are recognized when services are rendered. Commission revenue is recorded on a net basis. Other revence recognized periodically or according to contractual provisions Accounts Receivable Accounts receivable consists primary of receivables from non-consolidated franchisses, government and third party drug plans arising from prescription drug sales, independent accounts and amounts owed from vendors, and are recorded net et alowances Inventories The Company values inventories at the lower of cost and net resizable value Cost includes the cost of purchases net of vendor allowances plus other costs, such as transportation, we directly incurred to bring inventories to their present location and condition. The cost of inventories are measured at weighted average cos The Company estimates net realzable value as the amount that inventories are expected to be sold taking into consideration fututions in metal prices due to seasonality less estmated costs necessary to make the sale inventores are weten down to ret teaizable value when the cost of inventores s estimated to be unrecoverable due to obsolescence damage or decining selling prices. When circumstances that previously caused inventories to be written down below cost no longer exist or when there is clear evidence of an increase in seling prices, the amount of the write-down previously recorded is reversed Storage costs, Indirect administrative overhead and certain seling costs related to inventories are expensed in the period that these costs are incured Fixed Assets Fued assets we recognized and subsequently measured at cost less accumulated depreciation and any accumulated impairment losses. Cost includes expenditures that are directly attributable to the acquisition of the asset, including costs incurred prepare the asset for its intended use and capitalized borrowing costs. The commencement date for capitalcation of costs us when the Company fost incurs expenditures for the qualitying assets and undertakes the required activities to prepare the assets for the intended use Borowing costs directly butable to the acoustion construction or production of fixed assets that necessary take a substanta sence of time to prepare for their intended use and a proportionate share of general borrowings, we capitalized to the cost of refredates based on a quarterly weighted average cost of borrowing All other bonowing costs are expensed as incuted and recognized in net interest expense and other financing charges The cost of replacing a fixed asset component is recognized in the carrying amount it's probable that he future economic benefits embodied within the component wil sow to the Company and the cost can be measured elably. The carrying amount of the replaced component is derecognized. The cost of repairs and maintenance of fixed assets expensed as cured and recognized in GBA Gains and losses on disposal of fixed assets are determined by comparing the fair value of proceeds from Gispeal with the netbook value of the assets and are recognized net in operating income. For transactions in which the sale of a fred asset satisfies the requirements of IFRS 15 "Revenue tom Contracts with customers (IFRS 15), and the assets leased back by the Company, the Company recognizes in operating income, only the amount of gains or losses that relate to the nights transferred to the purchaser Fored assets are depreciated on a straight line basis over their estimated useful lives to their estimated residual value when the sets available for use. When significant parts of a feed asset have afferent usefulves, they are accounted for as separate components and depreciated separately. Depreciation methods, useful lives and residual values are reviewed annually and are adjusted for prospectively, appropriate Estimated useful lives are as follows: Buildings 10 to 40 years Equpment and fores 2 1 10 years Building improvements up to 10 years Leasehold improvements Lesser of term of the lease and use the up to 25 years Concury w nowy trente whether Faed asset are redened at each balance steet date to determine whether there is any indication et impairment. Refer to the impament of Non Facial Assetspolicy Investment Properties Investment properties are properties owned by the Company that are held to other earn rental income for capital appreciation, or bom. The Company's nvestment propenses include single tenant propertes held so eam rental income and certain file tenant properties. Land and buildings leased to franchisees are not accounted for as investment properties as these properties are related to the Company's operating activities Investment property assets are measured using the fair value modet under the fair value model investment properties are intaly measured at cost and subsequently measured at fair value. Gains and losses arising from changes in the fair value are recognized in Operating income in the period in which they arise. Gains and losses from disposal of investment properties are determined by comparing the fair value of disposal proceeds and the canying amount and are recognized in operating income When a property changes from own use to investment property, the property is remeasured to fair value Any gain arising from the remeasurement is recognized in operating income to the extent that reverses a previous impairmentions on that property with any remaining gain recognized in the Company's other comprehensive income. Any loss on remeasurement is recognized in operating income Al subsequent changes in fair value of the property are recognized in operating income. Upon sale of an investment property that was previously classified as fixed assets amounts included in the revaluation reserve are transferred to retained earnings When an investment property carried at tar value changes to own use the property is recognized in fxed assets are far value te date of change in use. The property is subsequently accounted for under the significant accounting policies for fixed assets Goodwill Goodwill arising in a business combination is recognized as an asset at the date that control is acquired. Goodwilis subsequently measured at costless accumulated impairment losses. Goodwil is not amortized but is tested for impairment on an annual basis or more frequently it here are indicators that goodwill may be impaired as desorbed in the impairment of Non-Financial Assets policy Intangible Assets intangible assets with inte lives are measured at cost less accumulated amortization and any accumulated impairment losses. These intangible assets are amortized on a straightene basis over their estimated useful lives, ranging from Sree to 15 years, and are tested for imparent as described in the Impairment of Non-Financial Assets policy. Useldives residus values and amorization methods for intangible asses with finite useful lives are reviewed at least annually. Amortization expense for intangible assets is recognized in SGSA Indefinitete intangible assets are measured at costless any accumulated impairmentiosses. These intangible assets are ested for impairment on an anu basis or more frequently if there are indicators that intangible assets may be impaired as described in the Impairment of Non-Financial Assets policy Customer Loyalty Awards Programs Key Sources of Estimation The Company defers revenue at the time the award is earned by members based on the river of the award. The relative air value is determined by alocating consideration between the air value of the loyalty amed by loyalty program members, net of breakage, and the goods and services on which the awards were camed, based on the rate stand-alone seling price. The estimated for value per point for the PC Optimum Program is determined based on the programs toward schedule and is $1 for every 1.000 points earned. The breakage rate of the program is an estimate of the amount of points that will never be redeemed The rate is reviewed on an ongoing basis and is estimated utilizing historical redemption activity and anticipated and redeem behaviour of members Note 14. Fixed Assets The following are continutes of the cost and the accumulated depreciation of freed assets for the years ended January 2, 2021 and December 25, 2016 20:20 $ 14473 306 720 (136 20 Dudings and LA millions of Canada Land Cost Balance, beginning of year 5 210 $ 1,7954.207: 3.873 Additions 132 26 Business acquisitions inte 5 Disposals (6) (45) 160) (25) Net transfer to assets held for sale (25) Net transfer from investment properties (note 15) 16 14 Transfer from assets under construction 25 25 412 170 Balance, end a yea 5 2265 1.779 $8.906 4045 Accumulated depreciation Balance, beginning of you 5 6535 6.1485 1.9805 Depreciation 506 281 Impairment losses 1 1 15 Reversal of impairment losses 3) 16 Disposals (20) 100 (24) Balance end of your 5 15 883 $ 6,8035 2.2395 Carrying amount as at January 2 2021 $ 2245 396 $ 22025 1.8055 Atelier de 2018 (702) 415 5 15.288 2 $ 3.89 (18) (104) 2 $ 9.728 213 $ 5.540 II 2019 Fence land Buildings and bugs bulding Equipment Leasehold Assets under (milions of Canadian dolara) Sunt Land improvements and fat and for construction To! Cost Balance, beginning of year $ 2305 1,772 $ 7.635 $ 3,715$ 950 $ 404 $ 14,706 IFRS 16 adjustments 142) (950) (992) Restated balance, beginning of year $ 230 $ 1,772 $ 7.593 $ 3,715 5 $ 404 $ 13,714 Additions 23 159 47 601 830 Business acquisitions (note 5) 1 66 67 Disposals (31) (31) (44) (19) (125 Net transfer to assets held for sale (9) (4) (13) Transfer from assets under construction 29 24 433 130 (616) Balance, end of year $ 2195 1,7855 8.207 $ 3.873 $ $ 389 $ 14,473 Accumulated depreciation Balance, beginning of year $ - $ 814 $ 57265 1894 $ 539 $ 2 $ 8.775 IFRS 16 adjustments (18) (539) (557) Restated balance, beginning of year $ 814 $ 5.708 $ 1,694 $ 2 $ 8.218 Depreciation 53 282 791 Impairment losses 10 23 23 56 Reversal of impairment losses (6) (1) (4) (11) Disposals (17) (38) (15) (70) Net transfer to assets held for sale (1) Balance, end of year $ $ 853 $ 8,148 $ 1.980 $ 2 $ 8,983 Carrying amount as at: December 28, 2019 $ 219 $ 9325 2.059 $ 1893 $ $ 397 $5.490 Additions to fodasindade 313 milion prepayment that was made in 2018. The balance was transformed from other sota in 2019 Assets under Construction The cost of additions to properties under construction for the year ended January 2, 2021 was 5728 milion (December 28, 2019 - $801 milion). There is a nominal amount of capitalized borrowing costs (2019 n) at a weighted average capitalization rate of 6.19% included in this balance Fixed Asset Commitments As at January 2, 2021, the Company had entered into commitments of $68 milion (December 28, 2019 - $128 million) for the construction expansion and renovation of buildings and the purchase of real property, $ $ $ 456 $ 2020 2019 $ 4930 Note 17. Goodwin The following are conteutes of the cost and the accumulated impairment of goodwill for the years endes denuary 2, 2021 and December 23, 2018 lite Canadian stanie Cost Balance beginning of your 4940 $ Business acquistions 2 Balance, end of your 5 4.3425 Accumulated impairment losses Balance, beginning of your 3 Impamentos Balance end of your S Carrying amount as at the end of the year $ 4940 $ 994 904 $ $ 994 3.948 994 3.946 The carrying amount of goodwil atributed to each cu grouping was as follows: tomando Shoppers Drug Mart Market Discount TST Supermarket in Al other Carrying amount as at the end of the year As at January 2, 2021 2.976 375 461 123 7 3.54 December 28, 2019 $ 2.974 375 461 120 $ 3.948 Note 23. Share Capital First Preferred Shares (authorized - 1.0 million shares) There were no First Preferred Shares outstanding as at January 2 2021 and December 28, 2019 Second Preferred Shares (authorized - unlimited The Company has outstanding 80 milion 5.30% novoting Second Preferred Shares Series B, with a tece value of $225 million, which were issued for net proceeds of $221 milion. These preferred shoes are presented as a component of equity on the consolidated balance sheets Common Shares (authorized - unlimited Common shares issued are fully paid and have no par value. The activities in the common shares issued and outstanding during the years were as follows Inition of Condotelisedicated issued and outstanding, beginning of year Issued for Setlement of stock options (note 28) Purchased and cancelled Issued and outstanding, end of year Shares held in trust, beginning of year Purchased for future settlement of RSUs and PSUs Released for settlement of RSUS and PSUs (noto 26) Shares held in trust, end of year issued and outstanding. net of shares held in trust end of year Weighted average outstanding, net of shares held in trust (note 8) Number of Common Common Share Shares Capital 360,064,475 $7.065 601.756 35 (13,304,751) (263) 347,361,480 $ 6,837 (1.113.302) (21) [145,000) (3) 585,518 11 (672,784) 5 (13) 346.688.696 $ 6,824 355 484 682 2019 Number of Common Common S Co 371790,967 $ 7.177 1986,733 94 (13513,225) 206) 360 064 475 $ 7,085 734 727) $ (15) 900.000) 521.425 10 (1.113.302) 5 211 358 951,173 $ 7.044 385 380,161 Dividends The declaration and payment of dividends on the Company's common shares and the amount thereof are at the discretion of the Board, which takes into account the Company's financial results, capital requirements, available cash fow, future prospects of the Company's business and other factors considered relevant from time to time. Over the long term is the Company's intention to increase the amount of the dividend while retaining appropriate free cash fow to finance future growth. In the fourth quarter of 2020 and in the second quarter of 2019, the Board raised the quarterly dividend by 90 02 to 50335 and by $0 02 to $0.315 per common share respectvely The following table summarizes the Company's cash videnda deciered for the years as indicated 2020 2019 Dividends declared per share (5) Common Share 5 1.280 5 1.240 Second Preferred Share, Series B 1.325 $ 1325 The button and tear 2000 to 25 producerado Connes on December 31. The tentar 2000 pe hare declared on www.don 2020 2019 ons al Canadian dollar Dividends declared Common Share Second Pretered Share Series 3 (note Total dividends declared $ $ 453 12 465 12 485 $ Subsequent to the end of the year, the Board declared a quartery dividend of 0.335 per common share, payable on April 2015 shareholders of record on March 15, 2021 and a quarterly dividend of 50 52 125 per share on the Second Preferred Shares. Series 3 payable on March 31, 2021 to shareholders of record on March 15, 2021 Note 30. Financial Risk Management As a result of holding and issuing financial instruments, the Company is exposed to liquidity, credit and market risk. The following is a description of those risks and how the exposures are managed Liquidity Liquidity risk is the risk that the Company is unable to generate or obtain sufficient cash or its equivalents in a cost effective manner to fund its obligations as they come due. The Company is exposed to liquidity risk through, among other areas. PC Bank, which requires a reliable source of funding for its credit card business. PC Bank relies on its securitization programs, demand deposits from customers and the acceptance of GIC deposits to fund the receivables of its credit cards. The Company would experience liquidity risks if it fails to maintain appropriate levels of cash and short term investments, it is unable to access sources of funding or it fails to appropriately diversity sources of funding. If any of these events were to occur, they could adversely affect the financial performance of the Company Liquidity risk is mitigated by maintaining appropriate levels of cash and cash equivalents and short term investments, actively monitoring market conditions, and by diversifying sources of funding, including the Company's committed credit facilities and maintaining a well- diversified matunty profile of debt and capital obligations Credit The Company is exposed to credit risk resulting from the possibility that counterparties could default on their financial obligations to the Company, including derivative instruments, cash and cash equivalents, short term investments, security deposits PC Bank's credit card receivables france lease receivable, pension assets held in the Company's defined benefit plans and accounts receivable. Failure to manage credit risk could adversely affect the financial performance of the Company The risk related to derivative instruments, cash and cash equivalents and short term investments is reduced by policies and guidelines that require that the Company enters into transactions only with counterparties or issuers that have a minimum long term "A credit rating from a recognized credit rating agency and place minimum and maximum limits for exposures to specific counterparties and instruments PC Bank manages its credit card receivable risk by employing stringent credit scoring techniques actively monitoring the credit card portfolio and reviewing techniques and technology that can improve the effectiveness of the collection process. In addition, these receivables are dispersed among a large diversified group of credt card customers. Finance lease receivable and accounts receivable, including amounts due from governments, prescription sales covered by third-party drug plans, independent accounts and amounts owed from vendors, are actively monitored on an ongoing basis and settled on a frequent basis in accordance with the terms specified in the applicable agreements. Market Market risk is the loss that may arise from changes in factors such as interest rates foreign currency exchange rates, commodity prices, common share price and the impact these factors may have on other counterparties Interest Rates The Company is exposed to interest rate risk from fuctuations in interest rates on its floating rate debt and from the refinancing of existing financial instruments. An increase in interest rates could adversely affect the operations or financial performance of the Company. The Company manages interest rate risk by monitoring the respective mix of foed and floating rate debt and by taking action as necessary to maintain an appropriate balance considering current market conditions with the objective of maintaining the majority of its debt at fred interest rates. The Company estimates that a 1% increase (decrease in short term interest rates, with all other variables held constant would result in an increase (decrease) of $8 million to net interest expense and other financing charges Currency Exchange Rates The Company is exposed to foreign currency exchange rate variability, primarily on its USD denominated purchases in trade payables and other liabilities. A depreciating Canadian dollar relative to the USD will have a negative impact on year- over-year changes in reported operating income and net earnings, while an appreciating Canadian dollar relative to the USD will have the opposite impact. The Company is also exposed to fluctuations in the prices of USD denominated purchases as a result of changes in USD exchange rates. To manage a portion of this exposure, the Company uses derivative instruments in the form of futures contracts and forward contracts to minimize cost volatility related to foreign exchange Commodity Prices The Company is exposed to increases in the prices of commodities in operating its stores and distribution networks, as well as to the indirect effect of changing commodity prices on the price of consumer products Rising commodity prices could adversely affect the financial performance of the Company. To manage a portion of this exposure, the Company uses purchase commitments and derivative Instruments in the form of exchange traded futures contracts and forward contracts to minimize cost volatility telated to commodites. The Company estimates that based on the outstanding derivative contracts held by the Company as at January 2 2021 10% decrease in relevant commodity prices, with all other variables held constant would result in a loss of $5 million on earnings before $5 Income taxes. Note 31. Contingent Liabilities In 2017, the Company and Weston announced actions taken to address their role in an industry-wide price-fixing arrangement involving certain packaged bread products. The arrangement involved the coordination of retail and wholesale prices of certain packaged bread products over a period extending from late 2001 to March 2015. Under the arrangement, the participants regularly increased prices on a coordinated basis. Class action lawsuits have been commenced against the Company and Weston as well as a number of other major grocery retailers and another bread wholesaler. It is too early to predict the outcome of such legal proceedings. Neither the Company nor Weston believes that the ultimate resolution of such legal proceedings will have a material adverse impact on its financial condition or prospects. The Company's cash balances far exceed any realistic damages scenario and therefore it does not anticipate any impacts on its dividend, dividend policy or share buyback plan. The Company has not recorded any amounts related to the potential civil liability associated with the class action lawsuits in 2020 or prior on the basis that a reliable estimate of the liability cannot be determined at this time. The Company will continue to assess whether a provision for civil liability associated with the class action lawsuits can be reliably estimated and will record an amount in the period at the earlier of when a reliable estimate of liability can be determined or the matter is ultimately resolved. As a result of admission of participation in the arrangement and cooperation in the Competition Bureau's investigation, the Company and Weston will not face criminal charges or penalties. Note 34. Segment Information The Company has two reportable operating segments, with all material operations carried out in Canada The Retail segment consists primarily of corporate and franchise-owned retail food and Associate-owned drugstores. The Retail segment also includes in-store pharmacies and other health and beauty products, apparel and other general merchandise and supports the PC Optimum Program. This segment is comprised of several operating segments that are aggregated primarily due to similarities in the nature of products and services offered for sale in the retail operations and the customer base, and The Financial Services segment provides credit card and everyday barking services, the PC Optimum Program, insurance brokerage services, and telecommunication services The Company's chief operating decision maker evaluates segment performance on the basis of adjusted EBITDA and adjusted operating income, as reported to internal management, on a periodic basis. Management's Discussion and Analysis 2 Overview The Company has to operating segments Retail and Financial Services. The Retail segment consists primarily of corporate and franchise-owned read bod and Associate-owned drugstores, includes in-store pharmacies and other health and beauty products are and other general merchandise and supports the PC Optimum Program. The Company's Financial Services segment providescreet card and everyday barking services, the PC Optimum Program, insurance brokerage services, and telecommunication services 5. Overall Financial Performance The COVID-19 pandemic acted the Company's operations throughout the year, Sales in the Food Retal business were positie impacted, however costs remained elevated to ensure the safety and security of customers and colleagues Lobain continued to deliver value in the categories that mean most to consumers, maintaining conventional drug and beauty market share improvements earned over course of the pandemic and improving its trajectory in discount. In Drug Retal strength in convenience categories supported front store sales while the perdenic negatively impacted higher margin categories Looking ahead the COVID-19 pandemic has accelerated certain longer-term trends enabling the Company to advance its strategic growth areas of Everyday Digital Retail Connected Healthcare Network, and Payments and Rewards Revenue Revenue was 552.7 million in 2020, an increase of $4.677 mlion compared to 2019, which includes the impact of the 536 week of 878 milion Food retal same-store sales growth was 8.8% (2019 -11%). Drug retail same-store sales growth was 29% 2019-3.8% Revenue was 48.837 miliona 2019. an increase of $1.344 million compared to 2018. Food retail same-stare sales growth was 1.15 (2018-119 Druget same store sales growth was 36% (2018-24%) The Company's Retal segment sales have continued to grow despite the pressure of a competitive retail market and an uncertain economic and regulatory enviroment over the last three years in 2018, the Company experienced food price inflation while druge prices were negatively added by the effects of incremental healthcare reform Sales in 2018 were also impacted by the disposition of gas bar operations in the third quarter of 2017 in 2019. Food retai prices were inflationary Drug retail prices were detalonary until the second quarter of 2019 when they retumed to being inflationary. In 2020, the COVID-19 pandemic had a significant impact on ou colleagues, customers suggles and other stakeholders. The Company experienced sales volatility and changes in sales as the pandemic impacted consumer behaviour throughout the year. Retal segment sales over the past three years were also impacted by the consolidation of franchisees The Company's Financial Services segment sales were negatively impacted by the COVID-18 pandemic from lower credit card related revenues from lower customer spending and lower sales atributable to the partial closure of The Mobile Shop koks during the second quarter of 2020 The Francial Services segment also launched the PC Money Account in the third quarter of 2020. an everyday barking product that allows account holders to earn PC Optimum points by making payments. In both 2019 and 2018, the Company's Francia Services segment sales conted to grow, mainly driven by growth in the credit card portfolio and The Mobile Shop 7.6 Share Capital First Preferred Shares (authorized 1.0 million shares) There were no Fest Preferred Shares outstanding as at January 2 2021 and December 28, 2019 Second Preferred Shares (authorized unlimited) The Company has outstanding 90 milion 530% non-voting Second Preferred Shares Series B, with a face value of $225 million, which were issued for net proceeds of $221 milion. These preferred shares are presented as a component of equity on the consolidated balance sheets Common Shares (authorized - unlimited) Common share issued are fully paid and have no par value. The activities in the common shares seed and outstanding during the years were as follows: 2020 Share milio Canada de except where indica Issued and outstanding, beginning of year Issued for settlement of stock options Purchased and cancelled Issued and outstanding, end of year Shares held in trust beginning of year Purchased for future settlement of RSUs and PSUS Released for settlement of RSUS and PSUs Shares held in trust end of year assed and outstanding net of shares held in trust end of year Weighted average outstanding, net of shares hold in trust (53 weeks Number of Common Common Shares Capital 350 064.475 $ 7,065 601,756 35 (13,304,751) (263) 347,361,480 $ 6,837 (1.113302) $ (21) (145,000) (3) 585,518 11 (672,784) $ (13) 345,688.696 $6,824 355.654.682 2019 (52) Number of Common Common Share Shares Capital 371,790,967 $ 7.177 1,886,733 94 (13,613 225) (205 380,064 475 $ 7,065 (734 727) $ (15) (900,000) (16) 521 425 10 (1,113,302) 5 (21) 358,951.173 $ 7,044 365,360,101 Dividends The declaration and payment of dividends on the Company's common shares and the amount thereof are at the discretion of the Company's Board of Directors (Board), which takes into account the Company's financial results capital requirements, avalable cash tow. ure prospects of the Company's business and other factors considered relevant from time to time. Over the long term. It is the Company intention to increase the amount of the dividend while retaining appropriate free cash flow to finance future growth in the fourth quarter of 2020 and in the second quarter of 2019, the Board raised the quarterly dividend by $0.02 to $0.335 and by $0.02 to $0.315 per common share, respectively The following table summarizes the Company's cash dividends declared for the years as indicated. 2019 Dividends declared per share (5) Common Share $ 1280 1240 Second Preferred Share Series B $ 1325 $ 1325 2020 The tun wander 2000 a 80336 pe store dices on Common Store west on Dember 30, 2020: Thut our own to 2020 3013 stare declared on Second round Shares Series Bwana 200 12. Enterprise Risks and Risk Management The effective govemance and management of risk within the Company is a key prionty for the Board and management and to this end, the Company has adopted an Enterprise Risk Management (ERM program The ERM program is all areas of the business in managing risks within appropriate leres of tolerance by bringing a systematic approach and methodology for evaluating measuring and monitoring key risks. The results of the ERM program and other business piening processes are used to identify emerging teks to the Company prioritize risk mitigation activities and develop arak-based internal audit plan Risks are not eminated through the ERM program, but rather are dentified and managed in line with the Company's risk appetite Statement and within approved risk tolerances The ERM program is designed to facilitate effective corporate governance by providing a consolidated view of risks across the Company enable the Company to focus on key risks that could impactis strategic objectives in order to reduce harm to financial performance through responsible risk management ensure that the Company's nak appetite and tolerances are defined and understood, and to provide a framework to promote the Company in engaging in activities within the approved risk appetite and tolerance levels promote a culture of awareness of risk management and compliance within the Company, . assist in developing consistent risk management methodologies and tools across the company including methodologies for the identification, assessment measurement and monitoring of risks and anticipate and provide early warnings of risks through key risk. Indicators Risk appetite and governance The Loblaw Board frough the Risk and Compliance Committee oversees the ERM program, includinga review of the Company's risks and risk priorization and annual approval of the ERM policy and Risk Appetite Statement. The Risk Appetite Statement articulates key aspects of the Company's businesses, values and brands and provides directional guidance on risk taking Key risk indicators are used to monitor and report on risk performance and whether the Company is operating within a risk appetite. Rok owners are assigned relevant risks by the Board and are responsible for managing risk and implementing tisk mitigation Strategies ERM framework Risk dentification and assessments are important elements of the Company's ERM process and framework. An annual ERM assessment is completed to assist in the update and identification of internal and external risks. This assessment is carried out in parallel with strategic planning through interviews, surveys and facilitated workshops with management and the board to sign stakeholder views. This assessment is completed for each business unit and aggregated where appropriate. Risis are assessed and evaluated based on the Companys vulnerability to the risk and the potential impact that the underying risks would have on the Company's ability to execute on s strategies and achieve es objectives and on the Company's fancial performance Risk monitoring and reporting on a quarterly basis, management provides an update to the Board (or a Committee of the Board on the status of key nisks based on significant changes from the prior update, anticipated impacts in future perods and significant changes in tay iskindicators. In addition, the long term risk level is assessed 10 monitor potential long term risk impects, which may assist in tisk mitigation planning activities Any of the key risks has the potential to negatively affect the Company and its financial performance. The Company has risk management Strategies in place for key risks. However, there can be no assurance that the risks will be mtigated or will not materialize of the event or circumstances will not occur that could adversely afect the reputation operations or financial condition or performance of the Company COVID-19 Risk On March 11, 2020, the World Health Organization declared COVID-19 a global pandemic Since the onset of the pandemic, the Company has taken and will contine to take actions to mitigate the effects of COVID-19 on its day-to-day business operations with the best interests of its employees, customers suppliers and other stakeholders at the crux of every action taken A dedicated COVD-19 response toam established by management in the early stages of the pandemic is coordinating the Company's criss management response. The Company's committed to keeping a grocery stores and pharmacies, including to Shoppers Drug Mart locations, open and stocked al while ensuring appropriate measures are in place to protect the hean and satety of its frontine colleagues and customers. The Company is also dedicated to promoting the health of the communities in which operates and has played an important role in asymptomatic COVID-19 testnen Canada The duration and ful impact of the COVID-19 pandemic on the Company remains unknown at this time As such, is not possible to reliably estimate the length and severity of COVID-19 reiste impacts on the future fnancial results and operations of the Company. The Company continues to closely monitor the situations tevolves day-to-day and may take further actions in response to directives of government and public health authorities or that are in the best interests of its colleagues customers, suppliers or other stateholders as necessary Consolidated Balance Sheets wy2.2121 1660 $ 20 3.100 5.195 216 100 11551 5540 7201 121 6820 3941 1133 57 1.14 3.634 5074 211 106 11310 5490 7362 172 7322 3.546 513 35.870 169 19 519 3309 $ 5 of Canada.com Assets Current Cash and cachentine Short term went inte Accounts receivable note 10) Credit Card reablete 11) Inventories incte 12 Prepaid expenses and others Assets held for sale ore 13) Totalmente Fredet for 14 Right note 28) Investment propertieste 15) Intangible sente 16 Goodall note 17 Deemed income taxe note 7) Franchise lansate 29 Other set 18 Total assets Les Current Bank indebtednessine 32 Teade payables and other babies Loyalty liability note 19 Prowione note 20 Income pale Demand depots from customers Short dette11) Long term deb do within one yerine 21) Lease abities or within one you note 28 Associate interest To Curenti Provisione none 20) Long term det inte 21) Losse bites note28 Deemed income talebites inte? Other abilities note 2 Total abities Equity Share capitalinote 23 Rendang Contributed Surplus note 26 Acorded the core come Total equity attributable to shareholders of the Company Non-controlling Total guilty Total liabilities and equity 86 5.380 14 18 5.121 191 27 24 575 597 137 30 875 1419 230 $ $ 130 EL 7.522 102 5971 7691 1539 252 24558 $ 500 24.751 $ $ 7.15 3:13 109 21 100 7255 3822 100 2 11 87 5 $ 3 $ $ 11119 35.870 Certain cours de resteren Contingentes pole $ $ 2020 52.714 36,725 13,624 2,365 742 1,623 431 1,192 $ $ Consolidated Statements of Earnings For the year ended January 2 2021 and December 28, 2018 millions of Canadian dollars except where otherwise indicated Revenue Cost of merchandise inventories sold Selling, general and administrative expenses Operating income Net interest expense and other financing charges (note 6) Earnings before income taxes Income taxes (note 7) Net earnings Attributable to Shareholders of the Company (note 8) Non-controlling interests Net earnings Net earnings per common share (5) (note 8) Basic Diluted Weighted average common shares outstanding (millions) (note 8) Basic Diluted 2019 48,037 33.281 12.486 2270 747 1,523 392 1.131 $ $ $ $ $ $ 1,108 84 1,192 1,081 50 1,131 $ $ $ 3.08 3.06 $ $ 2.93 2.90 3555 365.4 3684 3582 See accompanying notes to the consolidated financial statements 2020 2014 5 Consolidated Statements of Cash Flows For the penned my 2, 2012 december 28, 2011 (millions of Color Operating activities Neting Add Deducts Income taxe note Nettepense and other financing charge Adjustment to be wie of veren properties notes 19 and 15) Depreciation and Acetiments et covered Change in allowance for credit card recruited (note 11) Change in prostor (note 20 2.54 14 491 74 9 2.500 33 41 4 5.040 70 474 14523 7 4 34 5.191 41 4359 3 Change in one woning Capital Change in groot credit card cables inte11) Incontre paid 344 16301 16 5 33 3.NO 5 20 $ 14 012 Interest received to that note 21 Oher Cash flows from operating activities Investing activities Foeduse purchase note 14 Intangible asset to note 16) Cathassumed on initial consolidation of franchise note 5) Change in the investment Changendo Proceeds from disposal of iets Lease payments received from finance fees Oner Cash flows used in investing activities Financing activities Changenbandes Change in short term die note 11) Changinderat potom customers Long tim denote 20 (617) (376 20 37 800 113 2 05 76 9 (1030 10376 $ $ $ $ 6 (151 24 381 11801 1.417 11.400 034 06 (1024 500 672 (1.003 3491 387 8221 4801 82 Repayments Intrepid Cach rent dont le rote and 28) Cach rentadon labelsbe. Pro note 28) Dividends on common and preferred that Common share capital Isted note 26 Purchased and held in tirote 23) Purchased and could note 23 Proceed to the facing note 33 Other Cash flows used in financing activities Efect of foreign currency exchange rate changes on cach and cach equivalent Change in cash and can events Cach and cathet, beginning of you Cash and cash equivalents, end of year 337 $ 5 5 101 380 46 24 2021 2 535 1.133 1.666 5 5 5 3606 3 68 1005 1,133 5 Certain converse breed to conform wheresentation Changes in the Company s operations in response to COVID-19 could materially impact financial results and may include temporary closures of facilities, temporary or long-term labour shortages or disruptions temporary or long-term impacts on supply chains and darbution channels, temporary or long-term restrictions on cross-border commerce and wave including mandatory quarantine periods, greater currency volatility, and increased risics to IT systems, networks and digital services. In addition, the COVID-19 pandemic has changed consumer behaviours and accelerated the advancement of disruptve technologies and has resulted in a significant increase in commerce competition The Company sinability to keep up with the pace of such behavioural changes or technological advancements or with its competitors could adversely affect the contpany's operations or financial performance. The Company's performance may also be affected by the avalability and efficacy of vaccines and the effectiveness of plans to administer those vaccines across the country The spread of COVID-19 has caused an economic slowdown and increased volatility in fnancial markets. Governments and central banks have responded with monetary and fiscal interventions intended to stabilize economic conditions. Although the ultimate impact of COVID-19 on the global economy and its duration remains uncertain, disruptions caused by COVID-19 may adversely affect the performance of the Company Uncertain economic conditions resulting from the COVID-19 pandemic may, in the short or long term, adversely impact operations and the financial performance of the Company, including by adversely impacting demand for certain of the Company's products and services and or the debt and equitymarkets Governmental interventions aimed at containing COVID-19 could also impact the Company's available Workforce to supply chain and distribution channels, the products and services it is able to offer and or its ability to engage in cross-borde commerce 12.1 Operating Risks and Risk Management The following risks are a subset of the key risks dentified through the ERM program. They should be read in conjunction with the set of nisks inherent in the Company's business, as included in the Company's AIF for the year ended January 2, 2021, which is is hereby incorporated by reference Cybersecurity. Privacy and Date Breaches Inventory Management Electronic Commerce and Disruptive Technologies Govemance Change Management Process and Efficiency Competitive Environment and Strategy Service Providers Healthcare Reform Employee Attraction Development and Succession Planning IT Systems implementations and Data Management Economic Conditions Distribution and Supply Chain Franchise Relationships Labour Relations Associate-owned Drug Store Network and Relationships with Associates Food, Drug. Product and Services Safety Regulatory Compliance Legal Proceedings 14.2 Inventories Key Sources of Estimation Inventories are carried at the lower of cost and net realizable value which requires the Company to utilize estimates related to fuctuations in shrink, future retal prices. The impact of vendor rebates on cost seasonality and costs necessary to sel the inventory 14.4 Customer Loyalty Awards Programs Key Sources of Estimation The Company defees revenue at the time the award is earned by members based on the relative far value of the award. The relative fair value is determined by a locating consideration between the fair value of the loyalty awards earned by loyalty program members, net of breakage, and the goods and services on which the awards were earned, based on their relative stand-alone seling price. The estimated far value per point for the PC Optimur Program is determined based on the program reward schedule and is $1 for every 1,000 points earned. The breakage rate of the program is an estimate of the amount of points that will never be redeemed The rate is reviewed on an ongoing basis and is estimated utilizing historical redemption activity and anticipated eam and redeem behaviour of members Notes to the Consolidated Financial Statements For the years ended January 2, 2021 and December 28, 2019 millions of Canadan dollars except where otherwise indicated) Note 1. Nature and Description of the Reporting Entity Loblaw Companies Limited is a Canadian public company incorporated in 1956 and is Canada's food and pharmacy leader and the nation's largest retailer. Loblaw Companies Limited provides Canadians with grocery, pharmacy, health and beauty , apparel general merchandise, financial services, and wireless mobile products and services. Its registered office is located at 22 St Clair Avenue East Toronto, Canada M4T 257. Loblaw Companies Limited and its subsidiaries are together referred to in these consolidated financial statements, as the "Company" or "Loblaw The Company's controlling shareholder is George Weston Limited ("Weston"), which owns approximately 52.8% of the Company's outstanding common shares. The Companys ultimate parent is Willington Investments, Limited (Witington"). The remaining common shares are widely held The Company has two reportable operating segments: Retail and Financial Services (see note 34). Since the first quarter of 2020, the COVID-19 pandemic has had a significant impact on the Company. The Company's financial results for the year ended January 2 2021 show increased revenue, driven by increased demand for the Company's products, as well as increased cost of merchandise inventories sold. In addition, seling general and administrative expenses (SG&A) also increased as a result of the incremental cost of COVID-19 related investments to benefit and protect colleagues and customers. Note 2. Significant Accounting Policies Fiscal Year The fiscal year of the Company ends on the Saturday closest to December 31. Under an accounting convention common in the retail industry, the Company follows a 52-week reporting cycle, which periodicaly necessitates a fiscal year of 53 weeks. The year ended January 2, 2021 contained 53 weeks and the year ended December 28, 2019 contained 52 weeks. Net Earnings per Common Share Basic net earings per common share ("EPS) is calculated by dividing the net earnings available to common shareholders by the weighted average number of common shares outstanding during the penod, Diluted EPS is calculated by adjusting the net earnings available to common shareholders and the weighted average number of common shares outstanding for of the effects of all dilutive instruments Revenue Recognition The Company recognizes revenue when control of the goods or services has been transferred. Revenue is measured at the amount of consideration to which the Company expects to be entitled to, nuding variable consideration to the extent that it is highly probable that a significant reversal will not occur Retail Retail segment revenue includes the sale of goods and services to customers through corporate stores and consolidated franchise stores and Associates, and sales to non consolidated franchise stores and independent wholesale account customers. Revenue is measured at the amount of consideration to which the Company expects to be entitled to, net of estimated retums, sales incentives and franchise fee
Step by Step Solution
There are 3 Steps involved in it

Get step-by-step solutions from verified subject matter experts