

Question: .1)Make a table chart ir Excel form the financial analysis by common sizing both financial statements (income statement and balance sheet). May use the store
.1)Make a table chart ir Excel form the financial analysis by common sizing both financial statements (income statement and balance sheet). May use the store information and the ratios as quantitative substantiation.
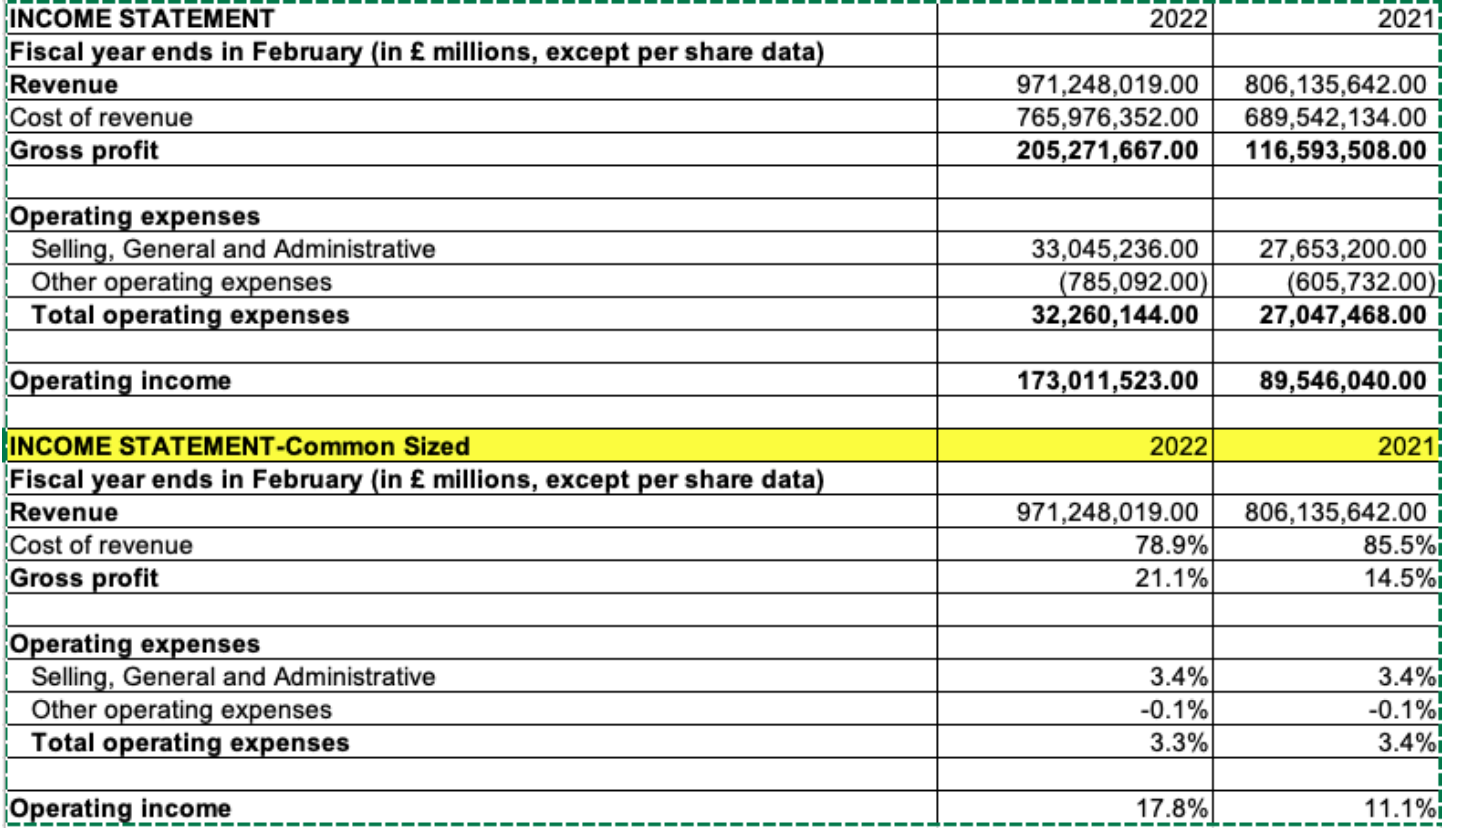
Use the example of the Income statement Common Size 2022-2021 for reference.
Part A) ---The balance sheet- Make a table chart , Excel or write it out
- Find the history of Property, Plant, Equipment and identify key take-aways
- Show case shareholder equity over time and identify key take-aways
- % increase year over year of the total value of assets and identify key take-aways
- % of increase year over year of the total value of liabilities and identify key take-away
Part B.) ----The income statement
- the revenue change year over year in percents using the value (total dollars) and identify key take-aways by using sales variance year-over-year as a percentage of (This Year-Last Year)/Last Year
Part C.) The cost of revenue over time and identify key take-aways
- ThE operating income over time and identify key take-aways
- the net income over time and identify key take-aways
----The ratios provided in Excel and identify key takeaways for each ratio
Example of Income statement Common Size example 2022-2021 reference.
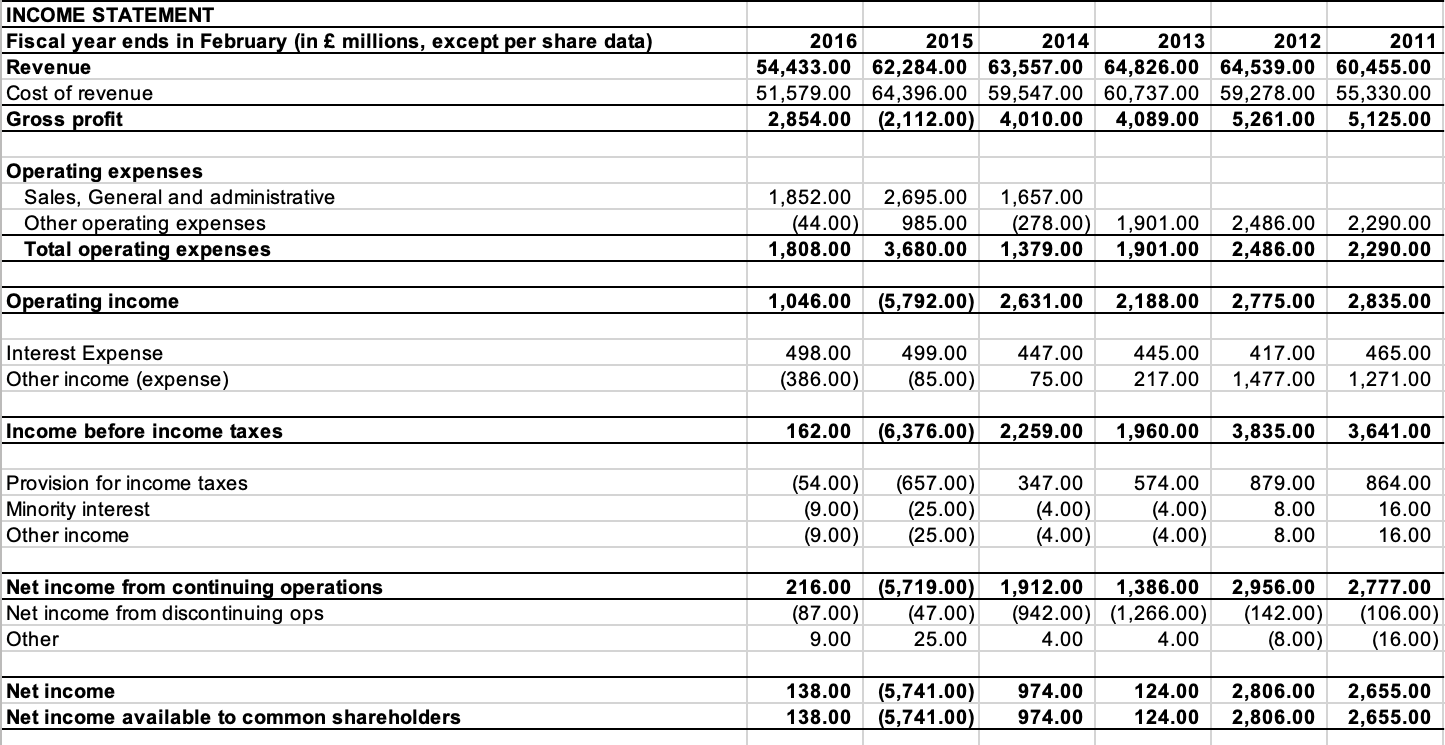
The income statement for 2011-2016
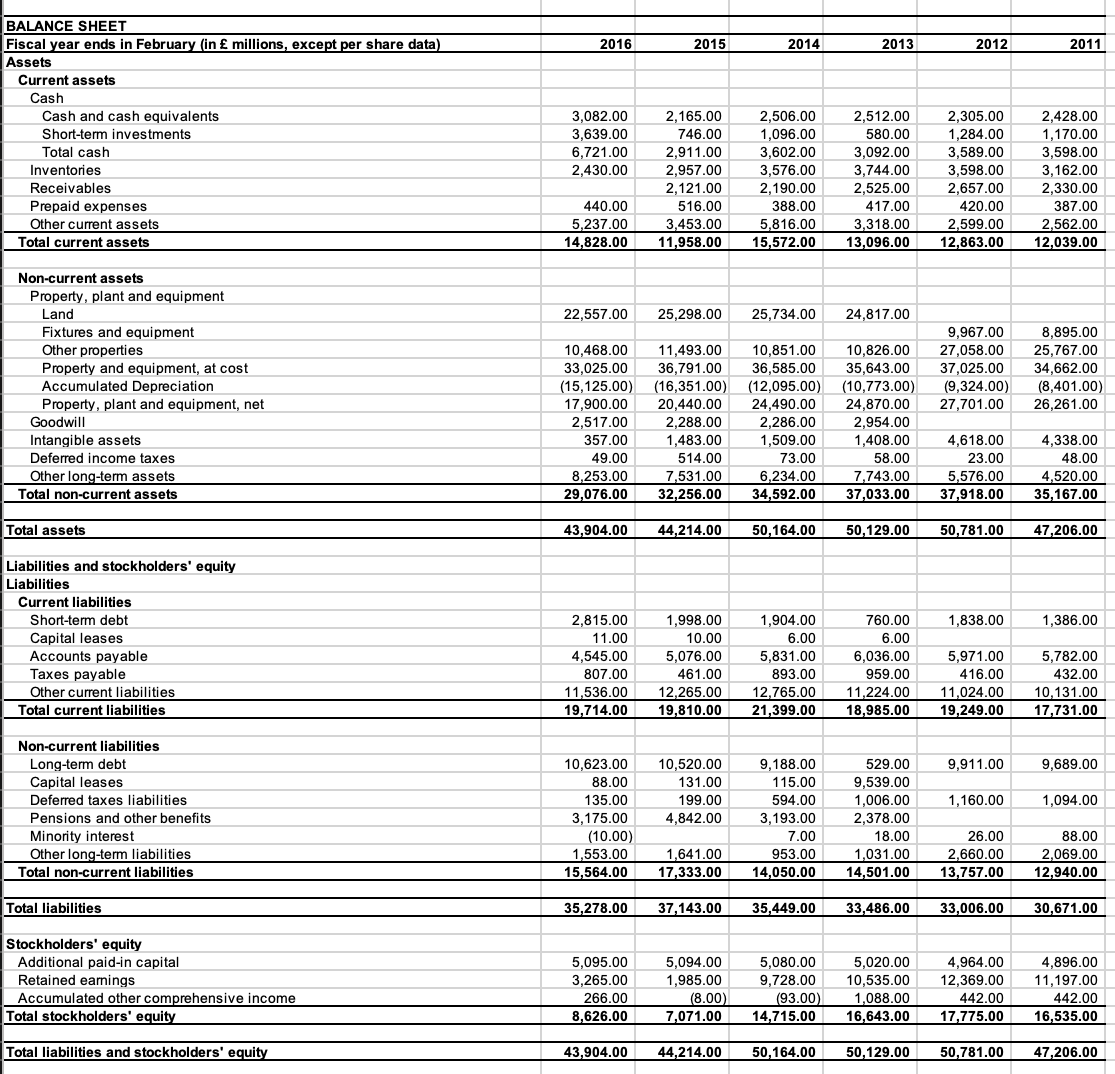
The Balance sheet for 2011-2016
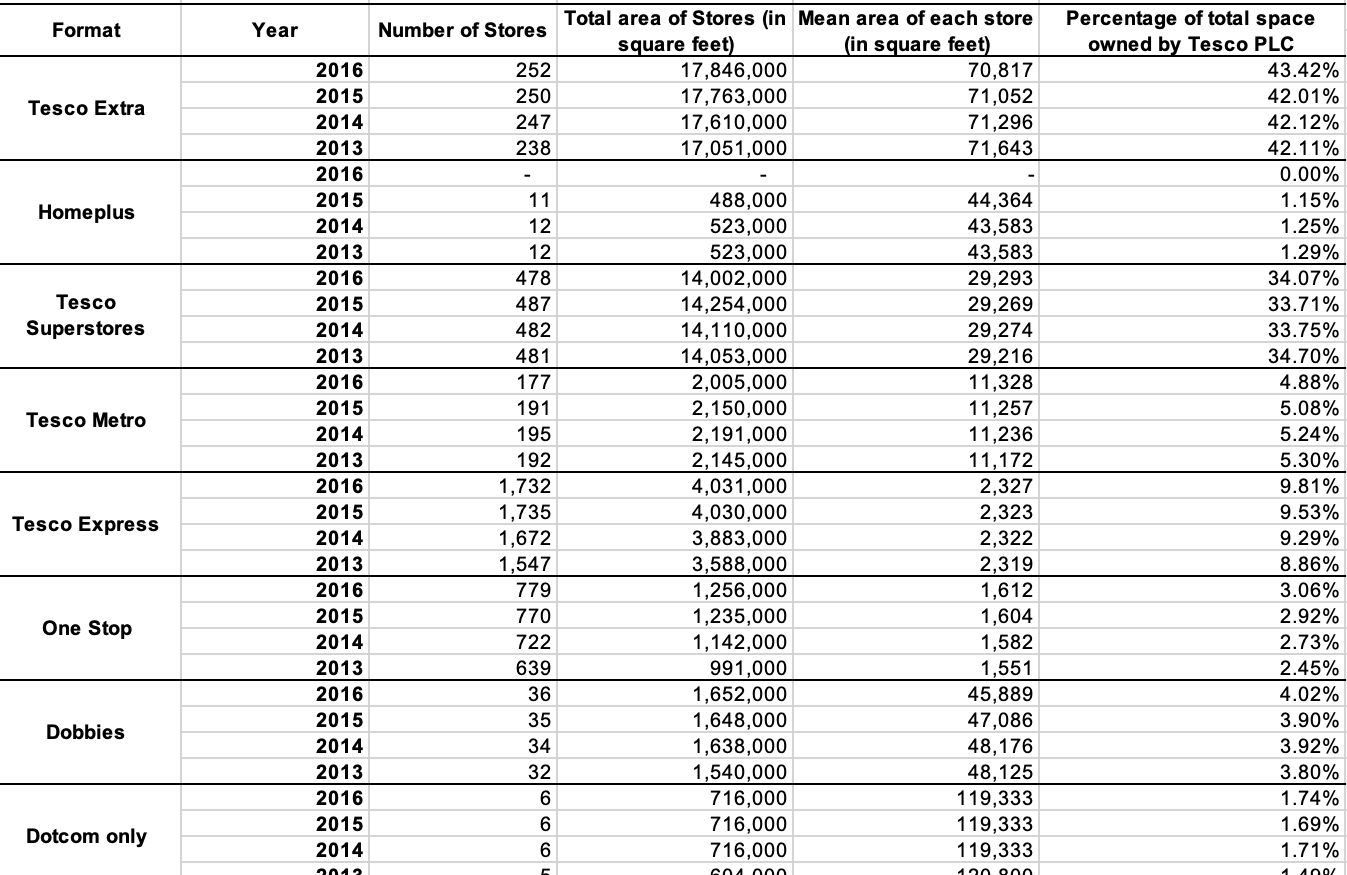
the store and ratios
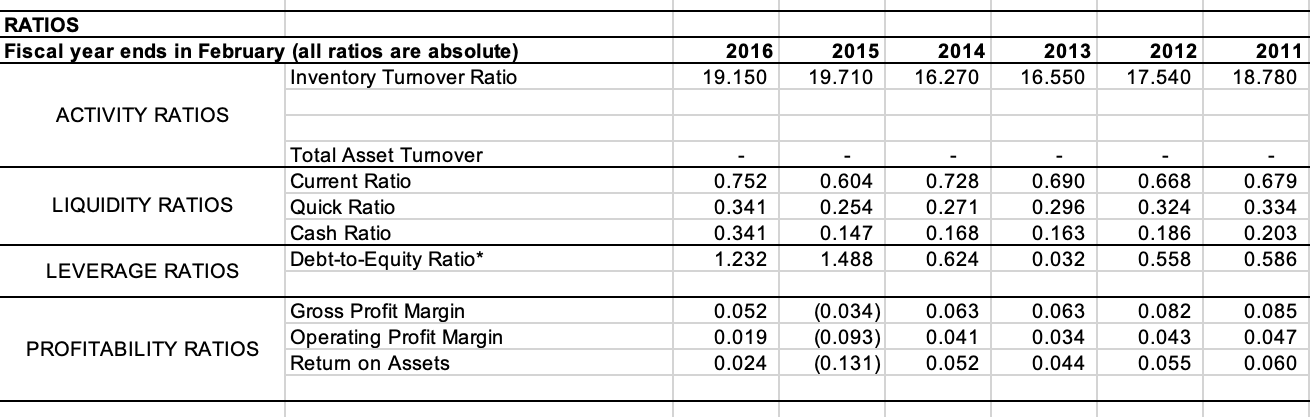
INCOME STATEMENT INCOME STATEMENT Operating expenses Operating income \begin{tabular}{|l|r|r|r|r|r|} \hline 1,046.00 & (5,792.00) & 2,631.00 & 2,188.00 & 2,775.00 & 2,835.00 \\ \hline \end{tabular} Interest Expense Other income (expense) \begin{tabular}{|c|c|r|r|r|r|} \hline 498.00 & 499.00 & 447.00 & 445.00 & 417.00 & 465.00 \\ \hline(386.00) & (85.00) & 75.00 & 217.00 & 1,477.00 & 1,271.00 \\ \hline \end{tabular} Income before income taxes \begin{tabular}{|l|l|r|r|r|r|} \hline 162.00 & (6,376.00) & 2,259.00 & 1,960.00 & 3,835.00 & 3,641.00 \\ \hline \end{tabular} Provision for income taxes Minority interest Other income \begin{tabular}{|r|r|r|r|r|r|} \hline(54.00) & (657.00) & 347.00 & 574.00 & 879.00 & 864.00 \\ \hline(9.00) & (25.00) & (4.00) & (4.00) & 8.00 & 16.00 \\ \hline(9.00) & (25.00) & (4.00) & (4.00) & 8.00 & 16.00 \\ \hline \end{tabular} BALANCE SHEET Fiscal year ends in February (in millions, except per share data) Assets Current assets Non-current assets Property, plant and equipment Land Fixtures and equipment Other properties Property and equipment, at cost Accumulated Depreciation Property, plant and equipment, net Goodwill Intangible assets Deferred income taxes Other long-term assets Total non-current assets Liabilities and stockholders' equity Liabilities Stockholders' equity RATIOS \begin{tabular}{|lrrrr|r|r|r|r|} \hline Fiscal year ends in February (all ratios are absolute) & 2016 & 2015 & 2014 & 2013 & 2012 & 2011 \\ \hline Inventory Turnover Ratio & 19.150 & 19.710 & 16.270 & 16.550 & 17.540 & 18.780 \\ \hline \end{tabular} ACTIVITY RATIOS \begin{tabular}{|l|l|l|l|l|l|l|l|} & Total Asset Turnover & - & - & - & - & - & - \\ \hline & Current Ratio & 0.752 & 0.604 & 0.728 & 0.690 & 0.668 & 0.679 \\ \hline \multirow{3}{*}{ LIQUIDITY RATIOS } & Quick Ratio & 0.341 & 0.254 & 0.271 & 0.296 & 0.324 & 0.334 \\ & Cash Ratio & 0.341 & 0.147 & 0.168 & 0.163 & 0.186 & 0.203 \\ \hline \multirow{2}{*}{ LEVERAGE RATIOS } & Debt-to-Equity Ratio* & 1.232 & 1.488 & 0.624 & 0.032 & 0.558 & 0.586 \\ \hline & & & & & & \\ \hline \multirow{3}{*}{ PROFITABILITY RATIOS } & & 0.052 & (0.034) & 0.063 & 0.063 & 0.082 & 0.085 \\ & Gross Profit Margin & 0.019 & (0.093) & 0.041 & 0.034 & 0.043 & 0.047 \\ & Operating Profit Margin & 0.024 & (0.131) & 0.052 & 0.044 & 0.055 & 0.060 \\ \hline & Return on Assets & & & & & \\ \hline \end{tabular} INCOME STATEMENT INCOME STATEMENT Operating expenses Operating income \begin{tabular}{|l|r|r|r|r|r|} \hline 1,046.00 & (5,792.00) & 2,631.00 & 2,188.00 & 2,775.00 & 2,835.00 \\ \hline \end{tabular} Interest Expense Other income (expense) \begin{tabular}{|c|c|r|r|r|r|} \hline 498.00 & 499.00 & 447.00 & 445.00 & 417.00 & 465.00 \\ \hline(386.00) & (85.00) & 75.00 & 217.00 & 1,477.00 & 1,271.00 \\ \hline \end{tabular} Income before income taxes \begin{tabular}{|l|l|r|r|r|r|} \hline 162.00 & (6,376.00) & 2,259.00 & 1,960.00 & 3,835.00 & 3,641.00 \\ \hline \end{tabular} Provision for income taxes Minority interest Other income \begin{tabular}{|r|r|r|r|r|r|} \hline(54.00) & (657.00) & 347.00 & 574.00 & 879.00 & 864.00 \\ \hline(9.00) & (25.00) & (4.00) & (4.00) & 8.00 & 16.00 \\ \hline(9.00) & (25.00) & (4.00) & (4.00) & 8.00 & 16.00 \\ \hline \end{tabular} BALANCE SHEET Fiscal year ends in February (in millions, except per share data) Assets Current assets Non-current assets Property, plant and equipment Land Fixtures and equipment Other properties Property and equipment, at cost Accumulated Depreciation Property, plant and equipment, net Goodwill Intangible assets Deferred income taxes Other long-term assets Total non-current assets Liabilities and stockholders' equity Liabilities Stockholders' equity RATIOS \begin{tabular}{|lrrrr|r|r|r|r|} \hline Fiscal year ends in February (all ratios are absolute) & 2016 & 2015 & 2014 & 2013 & 2012 & 2011 \\ \hline Inventory Turnover Ratio & 19.150 & 19.710 & 16.270 & 16.550 & 17.540 & 18.780 \\ \hline \end{tabular} ACTIVITY RATIOS \begin{tabular}{|l|l|l|l|l|l|l|l|} & Total Asset Turnover & - & - & - & - & - & - \\ \hline & Current Ratio & 0.752 & 0.604 & 0.728 & 0.690 & 0.668 & 0.679 \\ \hline \multirow{3}{*}{ LIQUIDITY RATIOS } & Quick Ratio & 0.341 & 0.254 & 0.271 & 0.296 & 0.324 & 0.334 \\ & Cash Ratio & 0.341 & 0.147 & 0.168 & 0.163 & 0.186 & 0.203 \\ \hline \multirow{2}{*}{ LEVERAGE RATIOS } & Debt-to-Equity Ratio* & 1.232 & 1.488 & 0.624 & 0.032 & 0.558 & 0.586 \\ \hline & & & & & & \\ \hline \multirow{3}{*}{ PROFITABILITY RATIOS } & & 0.052 & (0.034) & 0.063 & 0.063 & 0.082 & 0.085 \\ & Gross Profit Margin & 0.019 & (0.093) & 0.041 & 0.034 & 0.043 & 0.047 \\ & Operating Profit Margin & 0.024 & (0.131) & 0.052 & 0.044 & 0.055 & 0.060 \\ \hline & Return on Assets & & & & & \\ \hline \end{tabular}
Step by Step Solution
There are 3 Steps involved in it

Get step-by-step solutions from verified subject matter experts