

Question: 1.Market ModelSupply and Demand a. Plot the demand and supply curves using these schedules. Indicate the equilibrium price and quantity on your diagram. Note if
1.Market ModelSupply and Demand
a.Plot the demand and supply curves using these schedules. Indicate the equilibrium price and quantity on your diagram.
Note if you plot in excel see class exercises for example, instructions and these data.
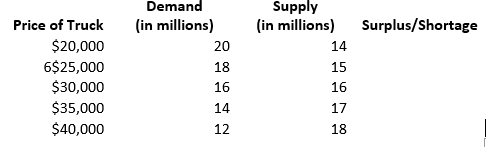
b.Fill in the last column of the table b calculating the surplus or shortage (=Supply-Demand) for each price.Does this verify you answer to part a?At what price would there be a shortage (give price and amount of shortage)?At what price would there be a surplus (give price and amount of surplus)?
c.Suppose the tires used on pickup trucks are found to be defective. What would you expect to happen in the market for pickup trucks? Show this on your diagram. What happened to equilibrium price and quantity?
d.Suppose that the U.S. Department of Transportation imposes costly regulations on manufacturers that cause them to reduce supply by one-third at any given price. Calculate and plot the new supply schedule and indicate the new equilibrium price and quantity on your diagram.

Demand Supply Price of Truck (in millions) (in millions) Surplus/Shortage $20,000 20 14 6$25,000 18 15 $30,000 16 16 $35,000 14 17 $40,000 12 18
Step by Step Solution
There are 3 Steps involved in it

Get step-by-step solutions from verified subject matter experts