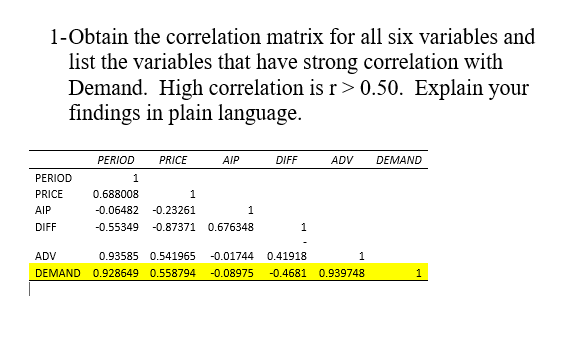
Question: 1-Obtain the correlation matrix for all six variables and list the variables that have strong correlation with Demand. High correlation is r > 0.50. Explain

1-Obtain the correlation matrix for all six

1-Obtain the correlation matrix for all six

1-Obtain the correlation matrix for all six variables and list the variables that have strong correlation with Demand. High correlation is r > 0.50. Explain your findings in plain language. PRICE AIP DIFF ADV DEMAND PERIOD 1 0.688008 -0.06482 -0.55349 PERIOD PRICE AIP DIFF 1 -0.23261 1 -0.87371 0.676348 1 ADV 0.93585 0.541965 DEMAND 0.928649 0.558794 -0.01744 -0.08975 0.41918 1 -0.4681 0.939748 1 Use 3-month and 6-month moving averages to predict the demand for January 2020. Find MAD for both forecasts and identify the preferred one based on each calculation. Is the moving average suitable method for forecasting for this data set? Explain your reasoning. 3m MA FOCS 6m MA Fors: 17.075 16.5833333 MAD = 0.71742424 MAD = 0.68297619

Step by Step Solution

There are 3 Steps involved in it

1 Expert Approved Answer
Step: 1 Unlock blur-text-image
Question Has Been Solved by an Expert!

Get step-by-step solutions from verified subject matter experts

Step: 2 Unlock
Step: 3 Unlock

Students Have Also Explored These Related General Management Questions!