

Question: 1.Perform QSPM analysis 2.Summarize your Strategy Recommendation 3.Perform EPS/EBIT analysis (You have to state your assumptions for this analysis) 4.Epilogue: I need your help:( Called
1.Perform QSPM analysis
2.Summarize your Strategy Recommendation
3.Perform EPS/EBIT analysis (You have to state your assumptions for this analysis)
4.Epilogue:
I need your help:(
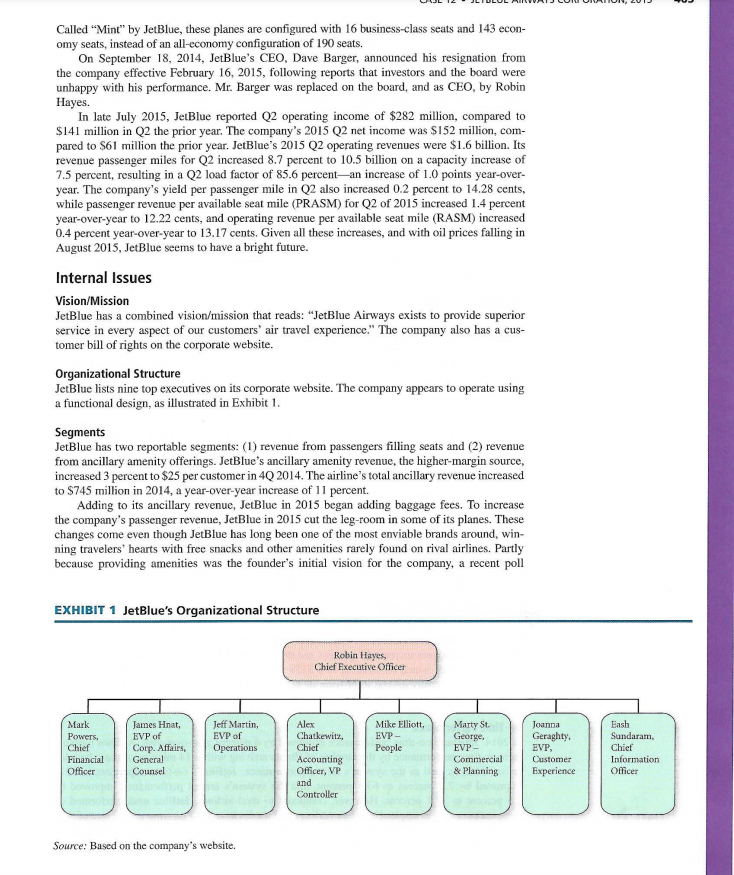
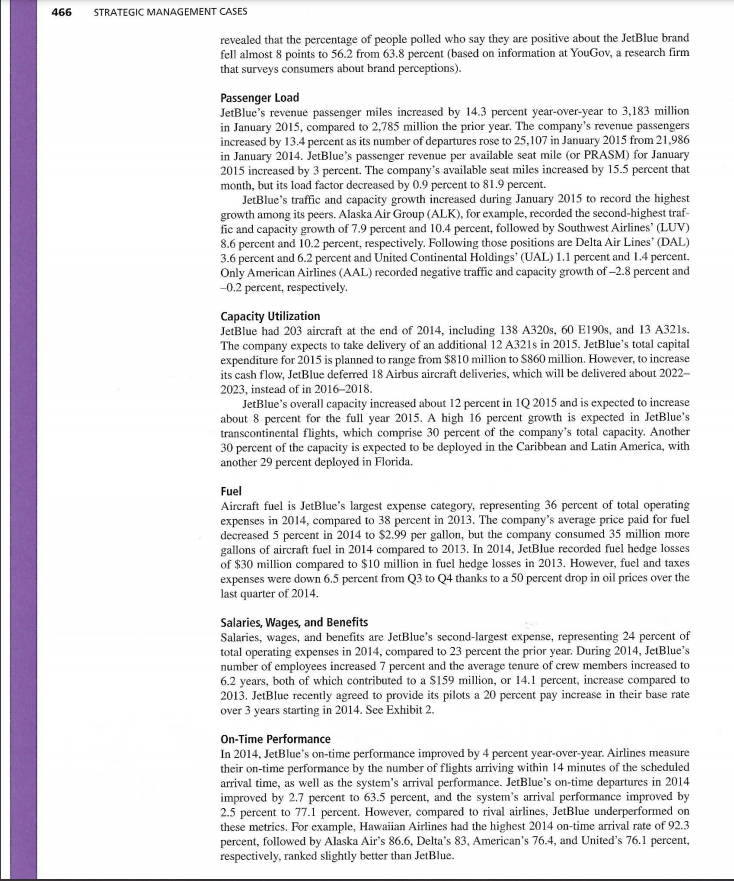
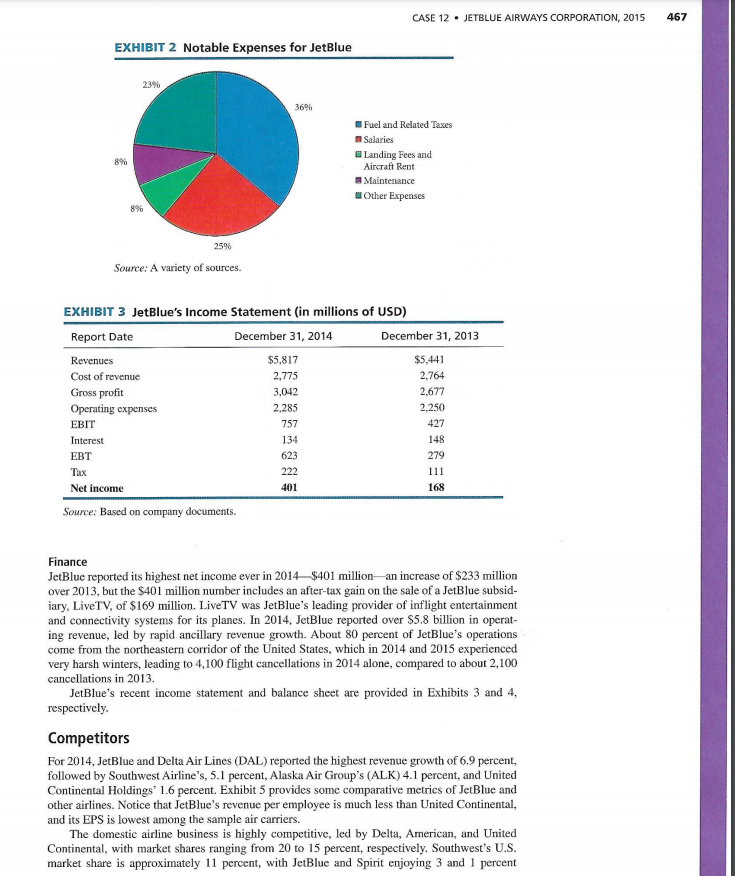
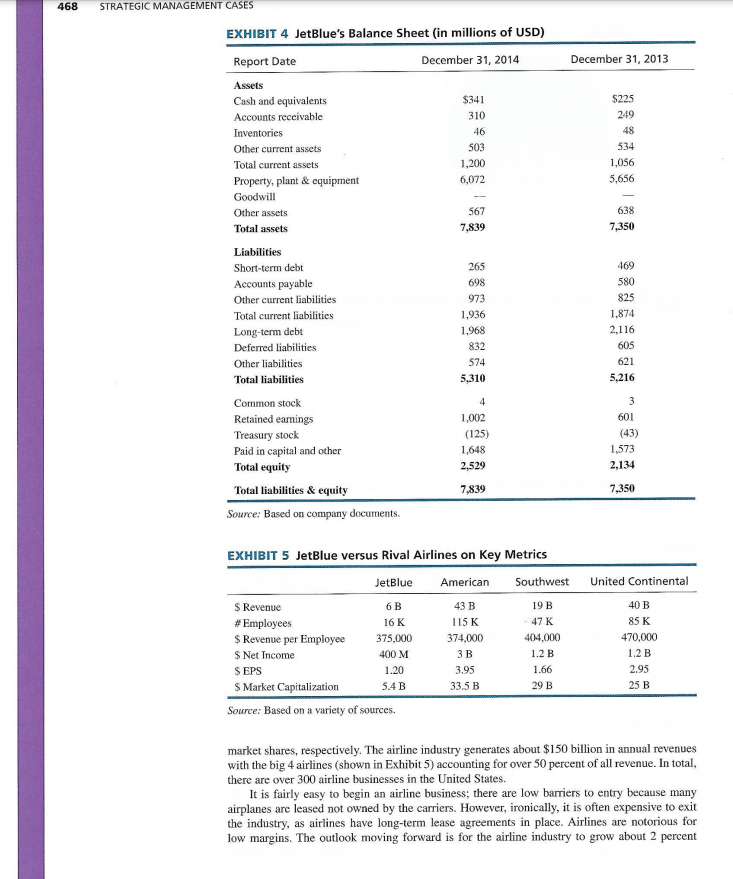
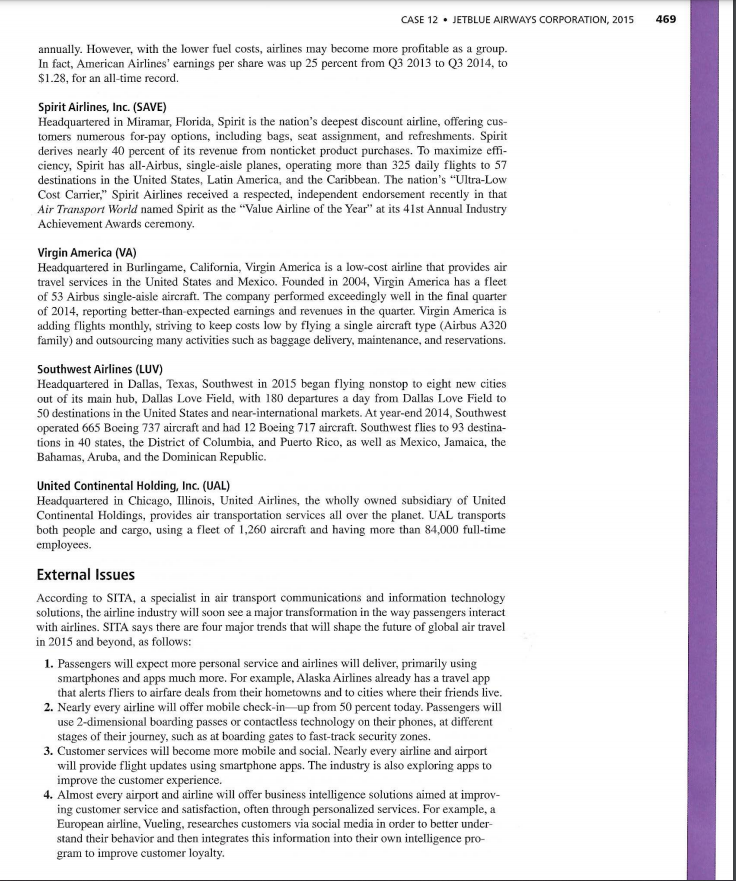
Called Mint" by JetBlue, these planes are configured with 16 business-class seats and 143 econ- omy seats, instead of an all-economy configuration of 190 seats. On September 18, 2014, JetBlue's CEO, Dave Barger, announced his resignation from the company effective February 16, 2015, following reports that investors and the board were unhappy with his performance. Mr. Barger was replaced on the board, and as CEO, by Robin Hayes. In late July 2015, JetBlue reported Q2 operating income of $282 million, compared to $141 million in Q2 the prior year. The company's 2015 Q2 net income was $152 million, com- pared to $61 million the prior year. JetBlue's 2015 Q2 operating revenues were $1.6 billion. Its revenue passenger miles for Q2 increased 8.7 percent to 10.5 billion on a capacity increase of 7.5 percent, resulting in a Q2 load factor of 85.6 percentan increase of 1.0 points year-over- year. The company's yield per passenger mile in Q2 also increased 0.2 percent to 14.28 cents, while passenger revenue per available seat mile (PRASM) for Q2 of 2015 increased 1.4 percent year-over-year to 12.22 cents, and operating revenue per available seat mile (RASM) increased 0.4 percent year-over-year to 13.17 cents. Given all these increases, and with oil prices falling in August 2015, JetBlue seems to have a bright future. Internal Issues Vision/Mission JetBlue has a combined vision/mission that reads: JetBlue Airways exists to provide superior service in every aspect of our customers' air travel experience." The company also has a cus- tomer bill of rights on the corporate website. Organizational Structure JetBlue lists nine top executives on its corporate website. The company appears to operate using a functional design, as illustrated in Exhibit 1. Segments JetBlue has two reportable segments: (1) revenue from passengers filling seats and (2) revenue from ancillary amenity offerings. JetBlue's ancillary amenity revenue, the higher-margin source, increased 3 percent to $25 per customer in 4Q 2014. The airline's total ancillary revenue increased to $745 million in 2014, a year-over-year increase of 11 percent. Adding to its ancillary revenue, JetBlue in 2015 began adding baggage fees. To increase the company's passenger revenue, JetBlue in 2015 cut the leg-room in some of its planes. These changes come even though JetBlue has long been one of the most enviable brands around, win- ning travelers hearts with free snacks and other amenities rarely found on rival airlines. Partly because providing amenities was the founder's initial vision for the company, a recent poll EXHIBIT 1 JetBlue's Organizational Structure Robin Hayes Chief Executive Officer Mark Powers, Chief Financial Officer James Hnat, EVP of Corp. Affairs, General Counsel Jeff Martin, EVP of Operations Mike Elliott, EVP- People Alex Chatkewitz, Chief Accounting Officer, VP and Controller Marty St George, EVP- Commercial & Planning Joanna Geraghty, EVP, Customer Experience Eash Sundaram, Chief Information Officer Source: Based on the company's website. 466 STRATEGIC MANAGEMENT CASES revealed that the percentage of people polled who say they are positive about the JetBlue brand fell almost 8 points to 56.2 from 63.8 percent (based on information at YouGov, a research firm that surveys consumers about brand perceptions). Passenger Load JetBlue's revenue passenger miles increased by 14.3 percent year-over-year to 3,183 million in January 2015, compared to 2,785 million the prior year. The company's revenue passengers increased by 13.4 percent as its number of departures rose to 25,107 in January 2015 from 21,986 in January 2014. JetBlue's passenger revenue per available seat mile (or PRASM) for January 2015 increased by 3 percent. The company's available seat miles increased by 15.5 percent that month, but its load factor decreased by 0.9 percent to 81.9 percent. JetBlue's traffic and capacity growth increased during January 2015 to record the highest growth among its peers. Alaska Air Group (ALK), for example, recorded the second-highest traf- fic and capacity growth of 7.9 percent and 10.4 percent, followed by Southwest Airlines' (LUV) 8.6 percent and 10.2 percent, respectively. Following those positions are Delta Air Lines' (DAL) 3.6 percent and 6.2 percent and United Continental Holdings (UAL) 1.1 percent and 1.4 percent. Only American Airlines (AAL) recorded negative traffic and capacity growth of -2.8 percent and -0.2 percent, respectively. Capacity Utilization JetBlue had 203 aircraft at the end of 2014, including 138 A320s, 60 E190s, and 13 A321s. The company expects to take delivery of an additional 12 A321s in 2015. JetBlue's total capital expenditure for 2015 is planned to range from $810 million to S860 million. However, to increase its cash flow, JetBlue deferred 18 Airbus aircraft deliveries, which will be delivered about 2022- 2023, instead of in 2016-2018. JetBlue's overall capacity increased about 12 percent in 1Q 2015 and is expected to increase about 8 percent for the full year 2015. A high 16 percent growth is expected in JetBlue's transcontinental flights, which comprise 30 percent of the company's total capacity. Another 30 percent of the capacity is expected to be deployed in the Caribbean and Latin America, with another 29 percent deployed in Florida. Fuel Aircraft fuel is JetBlue's largest expense category, representing 36 percent of total operating expenses in 2014, compared to 38 percent in 2013. The company's average price paid for fuel decreased 5 percent in 2014 to $2.99 per gallon, but the company consumed 35 million more gallons of aircraft fuel in 2014 compared to 2013. In 2014, JetBlue recorded fuel hedge losses of $30 million compared to $10 million in fuel hedge losses in 2013. However, fuel and taxes expenses were down 6.5 percent from Q3 to 24 thanks to a 50 percent drop in oil prices over the last quarter of 2014 Salaries, Wages, and Benefits Salaries, wages, and benefits are JetBlue's second-largest expense, representing 24 percent of total operating expenses in 2014, compared to 23 percent the prior year. During 2014, JetBlue's number of employees increased 7 percent and the average tenure of crew members increased to 6.2 years, both of which contributed to a $159 million, or 14.1 percent, increase compared to 2013. JetBlue recently agreed to provide its pilots a 20 percent pay increase in their base rate over 3 years starting in 2014. See Exhibit 2. On-Time Performance In 2014, JetBlue's on-time performance improved by 4 percent year-over-year. Airlines measure their on-time performance by the number of flights arriving within 14 minutes of the scheduled arrival time, as well as the system's arrival performance. JetBlue's on-time departures in 2014 improved by 2.7 percent to 63.5 percent, and the system's arrival performance improved by 2.5 percent to 77.1 percent. However, compared to rival airlines, JetBlue underperformed on these metrics. For example, Hawaiian Airlines had the highest 2014 on-time arrival rate of 92.3 percent, followed by Alaska Air's 86.6, Delta's 83, American's 76.4, and United's 76.1 percent, respectively, ranked slightly better than JetBlue. CASE 12. JETBLUE AIRWAYS CORPORATION, 2015 467 EXHIBIT 2 Notable Expenses for JetBlue 23% 3696 89% Fuel and Related Taxes Salaries Landing Fees and Aircraft Rent Maintenance Other Expenses 2596 Source: A variety of sources. EXHIBIT 3 JetBlue's Income Statement (in millions of USD) Report Date December 31, 2014 December 31, 2013 Revenues $5,817 $5,441 Cost of revenue 2,775 2,764 Gross profit 3,042 2.677 Operating expenses 2.285 2.250 EBIT 757 427 Interest 134 148 EBT 623 279 222 111 Net income 401 168 Source: Based on company documents. Tax Finance JetBlue reported its highest net income ever in 2014$401 million-an increase of $233 million over 2013, but the $401 million number includes an after-tax gain on the sale of a JetBlue subsid- iary, LiveTV, of $169 million, Live TV was JetBlue's leading provider of inflight entertainment and connectivity systems for its planes. In 2014, JetBlue reported over $5.8 billion in operat- ing revenue, led by rapid ancillary revenue growth. About 80 percent of JetBlue's operations come from the northeastern corridor of the United States, which in 2014 and 2015 experienced very harsh winters, leading to 4,100 flight cancellations in 2014 alone, compared to about 2,100 cancellations in 2013 JetBlue's recent income statement and balance sheet are provided in Exhibits 3 and 4, respectively. Competitors For 2014, JetBlue and Delta Air Lines (DAL) reported the highest revenue growth of 6.9 percent, followed by Southwest Airline's, 5.1 percent, Alaska Air Group's (ALK) 4.1 percent, and United Continental Holdings' 1.6 percent. Exhibit 5 provides some comparative metrics of JetBlue and other airlines. Notice that JetBlue's revenue per employee is much less than United Continental, and its EPS is lowest among the sample air carriers. The domestic airline business is highly competitive, led by Delta, American, and United Continental, with market shares ranging from 20 to 15 percent, respectively. Southwest's U.S. market share is approximately 11 percent, with JetBlue and Spirit enjoying 3 and 1 percent 468 STRATEGIC MANAGEMENT CASES December 31, 2013 $225 249 48 534 1,056 5,656 638 7,350 469 EXHIBIT 4 JetBlue's Balance Sheet (in millions of USD) Report Date December 31, 2014 Assets Cash and equivalents $341 Accounts receivable 310 Inventories 46 Other current assets 503 Total current assets 1,200 Property, plant & equipment 6,072 Goodwill Other assets 567 Total assets 7.839 Liabilities Short-term debt 265 Accounts payable 698 Other current liabilities 973 Total current liabilities 1,936 Long-term debt 1,968 Deferred liabilities 832 Other liabilities 574 Total liabilities 5,310 Common stock 4 Retained earnings 1,002 Treasury stock (125) Paid in capital and other 1,648 Total equity 2,529 Total liabilities & equity 7,839 Source: Based on company documents. 580 825 1,874 2,116 605 621 5,216 3 601 (43) 1,573 2,134 7,350 EXHIBIT 5 JetBlue versus Rival Airlines on Key Metrics JetBlue American Southwest United Continental $ Revenue 6B 43 B 19 B 40 B # Employees 16 K 115K 47 K 85 K $ Revenue per Employee 375,000 374,000 404,000 470,000 $ Net Income 400 M 3 B 1.2 B 1.2 B SEPS 1.20 3.95 1.66 2.93 S Market Capitalization 54B 33.5 B 29 B 25 B Source: Based on a variety of sources. market shares, respectively. The airline industry generates about $150 billion in annual revenues with the big 4 airlines (shown in Exhibit 5) accounting for over 50 percent of all revenue. In total, there are over 300 airline businesses in the United States. It is fairly easy to begin an airline business; there are low barriers to entry because many airplanes are leased not owned by the carriers. However, ironically, it is often expensive to exit the industry, as airlines have long-term lease agreements in place. Airlines are notorious for low margins. The outlook moving forward is for the airline industry to grow about 2 percent 469 CASE 12. JETBLUE AIRWAYS CORPORATION 2015 annually. However, with the lower fuel costs, airlines may become more profitable as a group. In fact, American Airlines' earnings per share was up 25 percent from Q3 2013 to Q3 2014, to $1.28, for an all-time record. Spirit Airlines, Inc. (SAVE) Headquartered in Miramar, Florida, Spirit is the nation's deepest discount airline, offering cus- tomers numerous for-pay options, including bags, seat assignment, and refreshments. Spirit derives nearly 40 percent of its revenue from nonticket product purchases. To maximize effi- ciency, Spirit has all-Airbus, single-aisle planes, operating more than 325 daily flights to 57 destinations in the United States, Latin America, and the Caribbean. The nation's "Ultra-Low Cost Carrier," Spirit Airlines received a respected, independent endorsement recently in that Air Transport World named Spirit as the "Value Airline of the Year" at its 41st Annual Industry Achievement Awards ceremony. Virgin America (VA) Headquartered in Burlingame, California, Virgin America is a low-cost airline that provides air travel services in the United States and Mexico. Founded in 2004, Virgin America has a fleet of 53 Airbus single-aisle aircraft. The company performed exceedingly well in the final quarter of 2014, reporting better than expected earnings and revenues in the quarter . Virgin America is adding flights monthly, striving to keep costs low by flying a single aircraft type (Airbus A320 family) and outsourcing many activities such as baggage delivery, maintenance, and reservations. Southwest Airlines (LUV) Headquartered in Dallas, Texas, Southwest in 2015 began flying nonstop to eight new cities out of its main hub, Dallas Love Field, with 180 departures a day from Dallas Love Field to 50 destinations in the United States and near-international markets. At year-end 2014, Southwest operated 665 Boeing 737 aircraft and had 12 Boeing 717 aircraft. Southwest flies to 93 destina- tions in 40 states, the District of Columbia, and Puerto Rico, as well as Mexico, Jamaica, the Bahamas, Aruba, and the Dominican Republic. United Continental Holding, Inc. (UAL) Headquartered in Chicago, Illinois, United Airlines, the wholly owned subsidiary of United Continental Holdings, provides air transportation services all over the planet. UAL transports both people and cargo, using a fleet of 1,260 aircraft and having more than 84,000 full-time employees. External Issues According to SITA, a specialist in air transport communications and information technology solutions, the airline industry will soon see a major transformation in the way passengers interact with airlines. SITA says there are four major trends that will shape the future of global air travel in 2015 and beyond, as follows: 1. Passengers will expect more personal service and airlines will deliver, primarily using smartphones and apps much more. For example, Alaska Airlines already has a travel app that alerts fliers to airfare deals from their hometowns and to cities where their friends live. 2. Nearly every airline will offer mobile check-in-up from 50 percent today. Passengers will use 2-dimensional boarding passes or contactless technology on their phones, at different stages of their journey, such as at boarding gates to fast-track security zones. 3. Customer services will become more mobile and social. Nearly every airline and airport will provide flight updates using smartphone apps. The industry is also exploring apps to improve the customer experience. 4. Almost every airport and airline will offer business intelligence solutions aimed at improv- ing customer service and satisfaction, often through personalized services. For example, a European airline, Vueling, researches customers via social media in order to better under- stand their behavior and then integrates this information into their own intelligence pro- gram to improve customer loyalty. 470 STRATEGIC MANAGEMENT CASES Market Segmentation The airlines cater to a variety of customers but generally customers are categorized as coach, first class, business class, and freight. Coach passenger revenue tends to account for 80 percent of all revenue generated by air service companies. This revenue includes extra bag fees, food and drink, and all other fees associated with coach class passengers. Business class and first class passengers account for 10 and 5 percent of total revenues, respectively, with freight accounting for 3 percent of total industrywide revenues. Airlines Hoarding Cash Fearing economic downturns, airlines generally keep substantial cash on their balance repre- sents. For example, Delta reported $5 billion in 2014 cash and short-term investments to 2013 revenues of $37 billion or 14 percent of revenue. American Airlines reported 2014 cash and equivalents of $8 billion, about 30 percent of revenue. JetBlue, for example, from 2012 to 2014 increased its cash position by 87 percent to $341 million. Delta increased its cash balance by 25 percent over the same time frame. Overall, the industry's 2014 revenue passenger miles were up 2.5 percent, with passenger revenues rising 5 percent. Another area driving up cash balances and revenues for airlines are ancillary fees. Currently, 16 U.S. airlines charge baggage fees, total- ing $3.4 billion in 2013. Reservation change fees generated another $2.8 billion in 2013 revenues for the airline industry. Generally met with great distaste and resistance among passengers, after being customary in the industry for a number of years now, most customers are now accustomed to the ancillary fees charged by airlines. Airline Pollution Concerns Airlines for years have fought the perception they are a major source of greenhouse gasses. Most airlines routinely list the ways in which they have reduced jet fuel usage and as a result greenhouse gases. Many of the ways listed, however, are often through higher fees on customers. Baggage fees, heavy bag surcharges, lack of free drinks and food, tighter seating arrangements, and smaller more fuel-efficient plans all have helped to reduce weight at the direct expense of customer comfort. So the jury remains out on the true motives of airlines in the battle against greenhouse gas emissions. Another interesting development in the industry is the use of biofuels instead of traditional jet fuel. Several firms, such as Continental and KLM Royal Dutch Airlines, have experimented with biofuels since 2009, but there does not appear to be industrywide acceptance or a hurry to switch in the foreseeable future. Airline Taxes Airlines pay high taxes. Delta, Spirit, JetBlue, and Southwest all paid taxes between 35 and 38.5 percent in 2014. However, American Airlines paid taxes of 11 percent and United Continental received a tax credit in 2014. President Obama recently proposed raising taxes on airlines to help reduce the federal deficit, improve immigration, improve airports, and reduce the wait-time for processing foreign visitors. Obama's new airline tax plan would add between $2.50 and $9 per ticket one way. The cost of any new taxes is expected to be passed on to the consumer. Tax increases may not seem like much in absolute terms, but one analyst suggested a $300 domestic ticket's taxes that are currently $61 would increase to $75, amounting to a staggering 23 percent tax increase. To compare what a 23 percent tax high relates to the inflation rate in the United States during 2014 was around 1.5 percent. Mergers Dominate the Industry Two notable recent mergers include United and Continental and US Airways and American Airlines. While possibly attractive, at least in the short term for the airlines, the mergers came at the expense of substantial goodwill on the balance sheets. American, for example, reported no goodwill in 2012, yet after the merger with US Air, the new firm reported over $4 billion in goodwill. United Continental reports over $4 billion in goodwill on its balance sheet. The likely benefit for these firms is with reduced competition will come the ability to more easily raise airline ticket prices. In addition to higher prices facing airline passengers, airline CEOs are also altering their market share-grabbing strategy by focusing on the most profitable area routes, reducing redundant routes, no longer serving certain routes, and being able to charge more for ancillary feesStep by Step Solution
There are 3 Steps involved in it
1 Expert Approved Answer
Step: 1 Unlock

Question Has Been Solved by an Expert!
Get step-by-step solutions from verified subject matter experts
Step: 2 Unlock
Step: 3 Unlock