

Question: 1Q and Lead Exposure: Step 4 Conclusions The data set IQLEAD (found in the lab description) lists full IQ scores for a random sample of
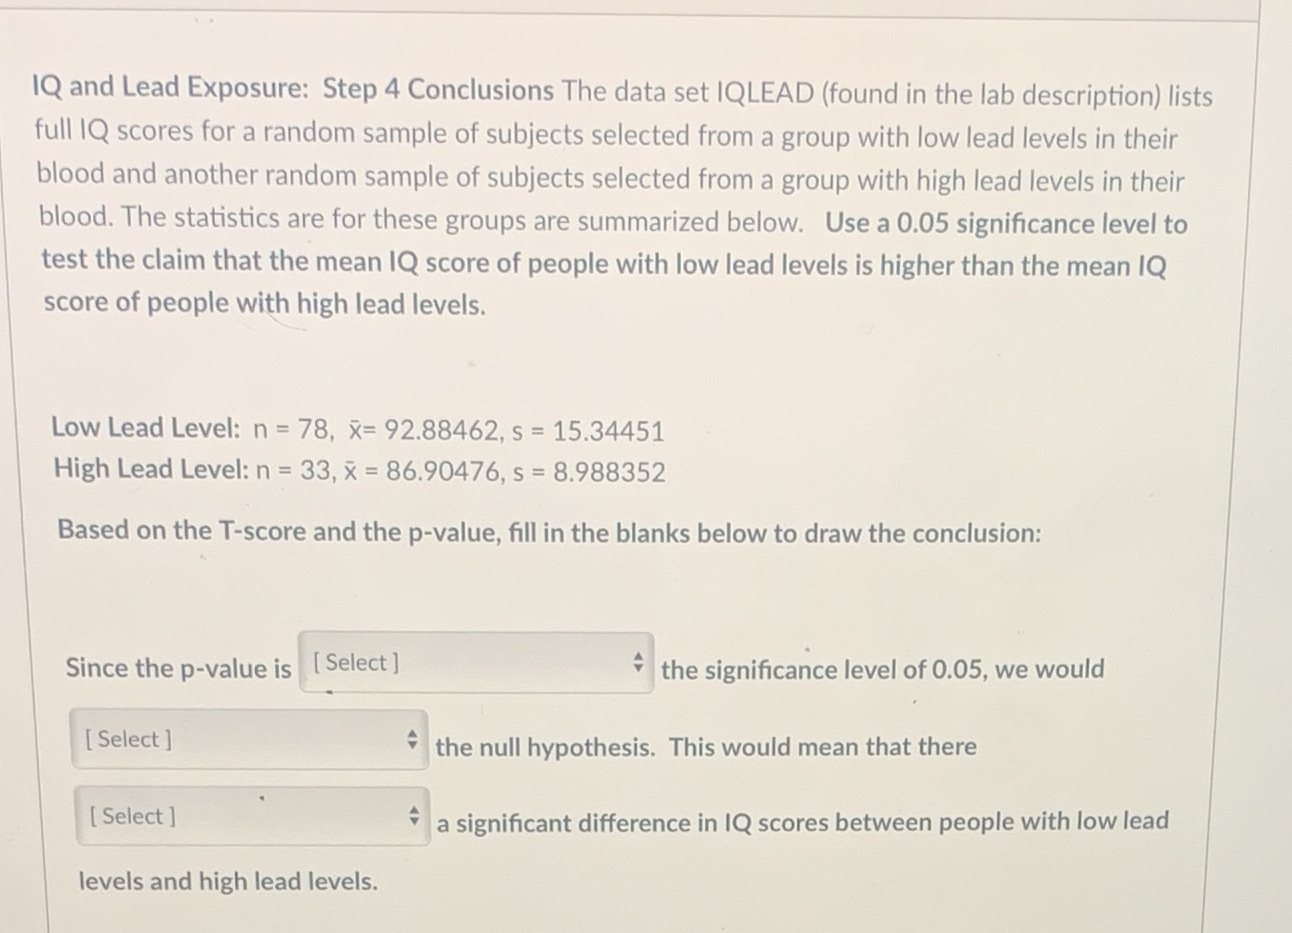
1Q and Lead Exposure: Step 4 Conclusions The data set IQLEAD (found in the lab description) lists full IQ scores for a random sample of subjects selected from a group with low lead levels in their blood and another random sample of subjects selected from a group with high lead levels in their blood. The statistics are for these groups are summarized below. Use a 0.05 significance level to test the claim that the mean IQ score of people with low lead levels is higher than the mean IQ score of people with high lead levels. Low Lead Level: n = 78, x= 92.88462, s = 15.34451 High Lead Level: n = 33, x = 86.90476, s = 8.988352 Based on the T-score and the p-value, fill in the blanks below to draw the conclusion: Since the p-value is [Select ] the significance level of 0.05, we would [ Select ] the null hypothesis. This would mean that there [ Select ] a significant difference in IQ scores between people with low lead levels and high lead levels
Step by Step Solution
There are 3 Steps involved in it

Get step-by-step solutions from verified subject matter experts