

Question: OptionsBlank one : 95,5,1,99Blank two: 0,5,-5Blank three: in, not in D Question 9 3 pts 1Q and Lead Exposure: Confidence Interval (cont) The data set
OptionsBlank one : 95,5,1,99Blank two: 0,5,-5Blank three: in, not in
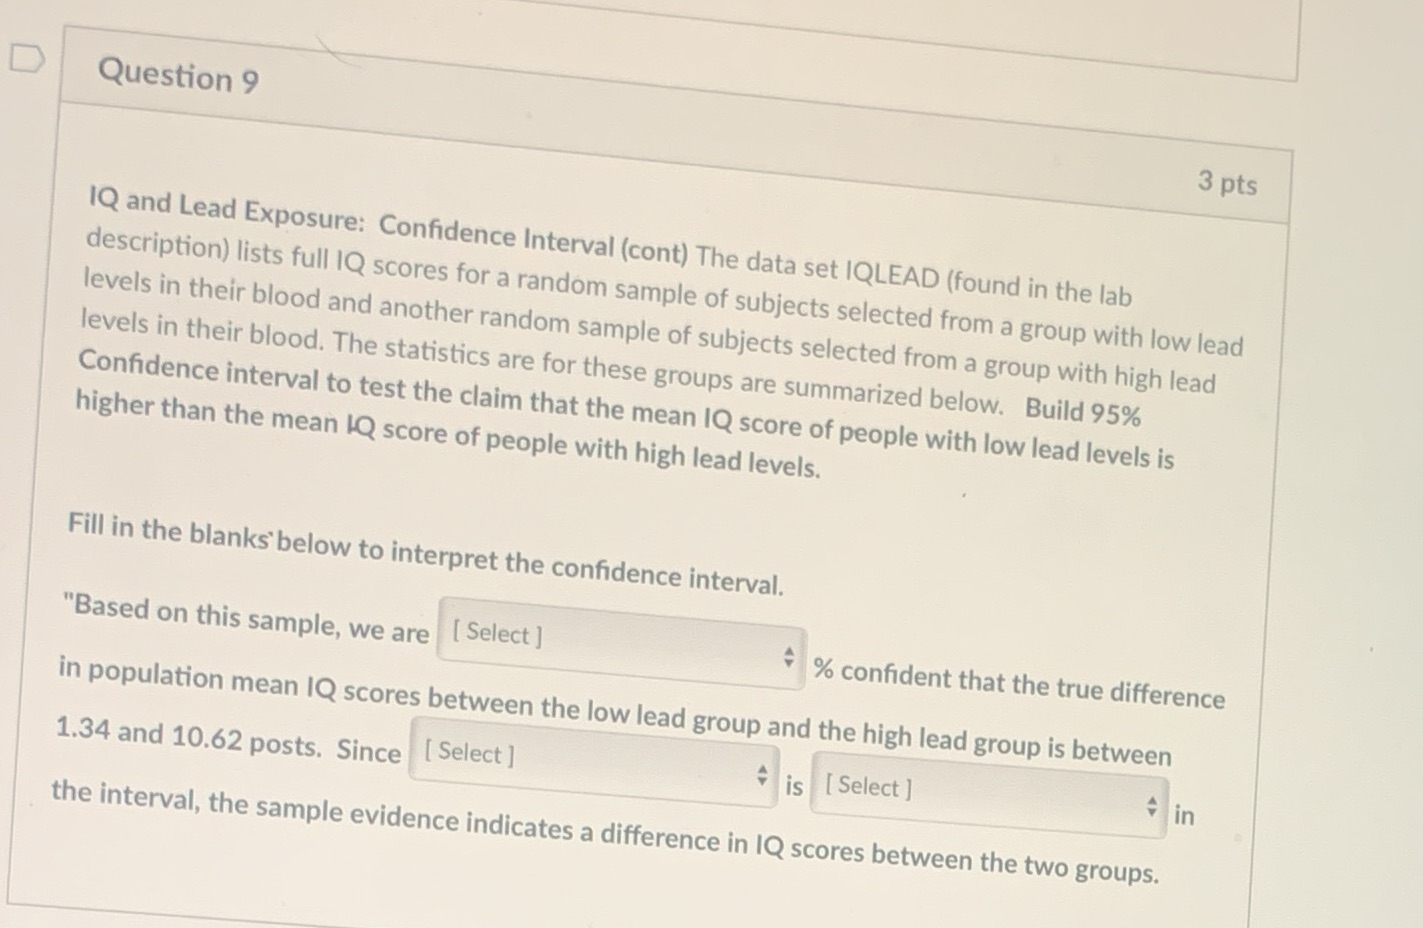
D Question 9 3 pts 1Q and Lead Exposure: Confidence Interval (cont) The data set IQLEAD (found in the lab description) lists full IQ scores for a random sample of subjects selected from a group with low lead levels in their blood and another random sample of subjects selected from a group with high lead levels in their blood. The statistics are for these groups are summarized below. Build 95% Confidence interval to test the claim that the mean IQ score of people with low lead levels is higher than the mean IQ score of people with high lead levels. Fill in the blanks' below to interpret the confidence interval. "Based on this sample, we are [ Select ] # % confident that the true difference in population mean IQ scores between the low lead group and the high lead group is between 1.34 and 10.62 posts. Since [ Select ] is [ Select ] in the interval, the sample evidence indicates a difference in IQ scores between the two groups
Step by Step Solution
There are 3 Steps involved in it

Get step-by-step solutions from verified subject matter experts