

Question: 1st missing data (population proportion or sample proportion. 2nd missing data (less than the upper endpoint, between the endpoints, not between or greater than the
1st missing data (population proportion or sample proportion. 2nd missing data (less than the upper endpoint, between the endpoints, not between or greater than the lower endpoints)
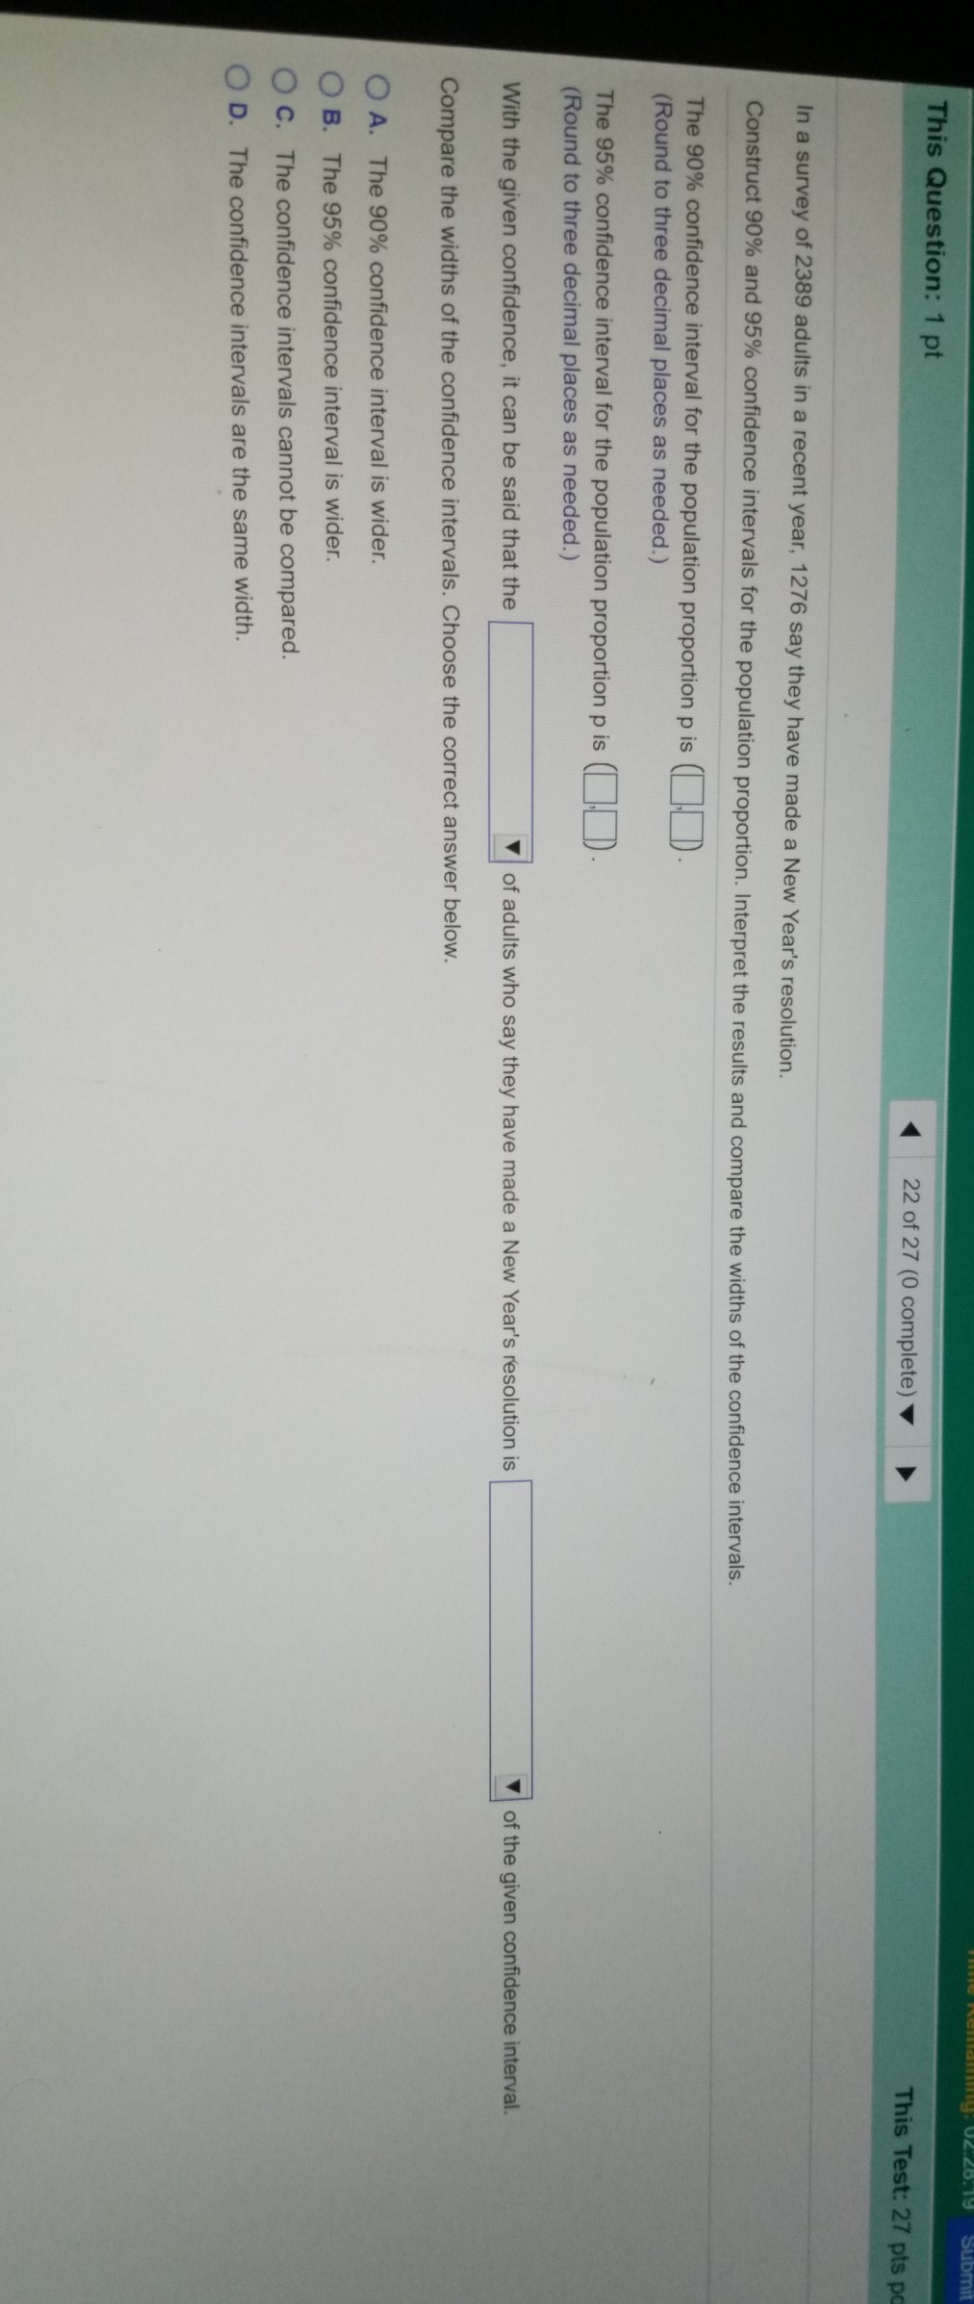
This Question: 1 pt 22 of 27 (0 complete) This Test: 27 pts p In a survey of 2389 adults in a recent year, 1276 say they have made a New Year's resolution. Construct 90% and 95% confidence intervals for the population proportion. Interpret the results and compare the widths of the confidence intervals. The 90% confidence interval for the population proportion p is (]D). (Round to three decimal places as needed.) The 95% confidence interval for the population proportion p is (].) (Round to three decimal places as needed.) With the given confidence, it can be said that the of adults who say they have made a New Year's resolution is of the given confidence interval. Compare the widths of the confidence intervals. Choose the correct answer below. O A. The 90% confidence interval is wider. O B. The 95% confidence interval is wider. O C. The confidence intervals cannot be compared. O D. The confidence intervals are the same width
Step by Step Solution
There are 3 Steps involved in it

Get step-by-step solutions from verified subject matter experts