

Question: 1st question based on anova I already did based on this anova info for question 1 Oneway Descriptives HAPPINESS OF MARRIAGE 95% Confidence Interval for
1st question based on anova I already did
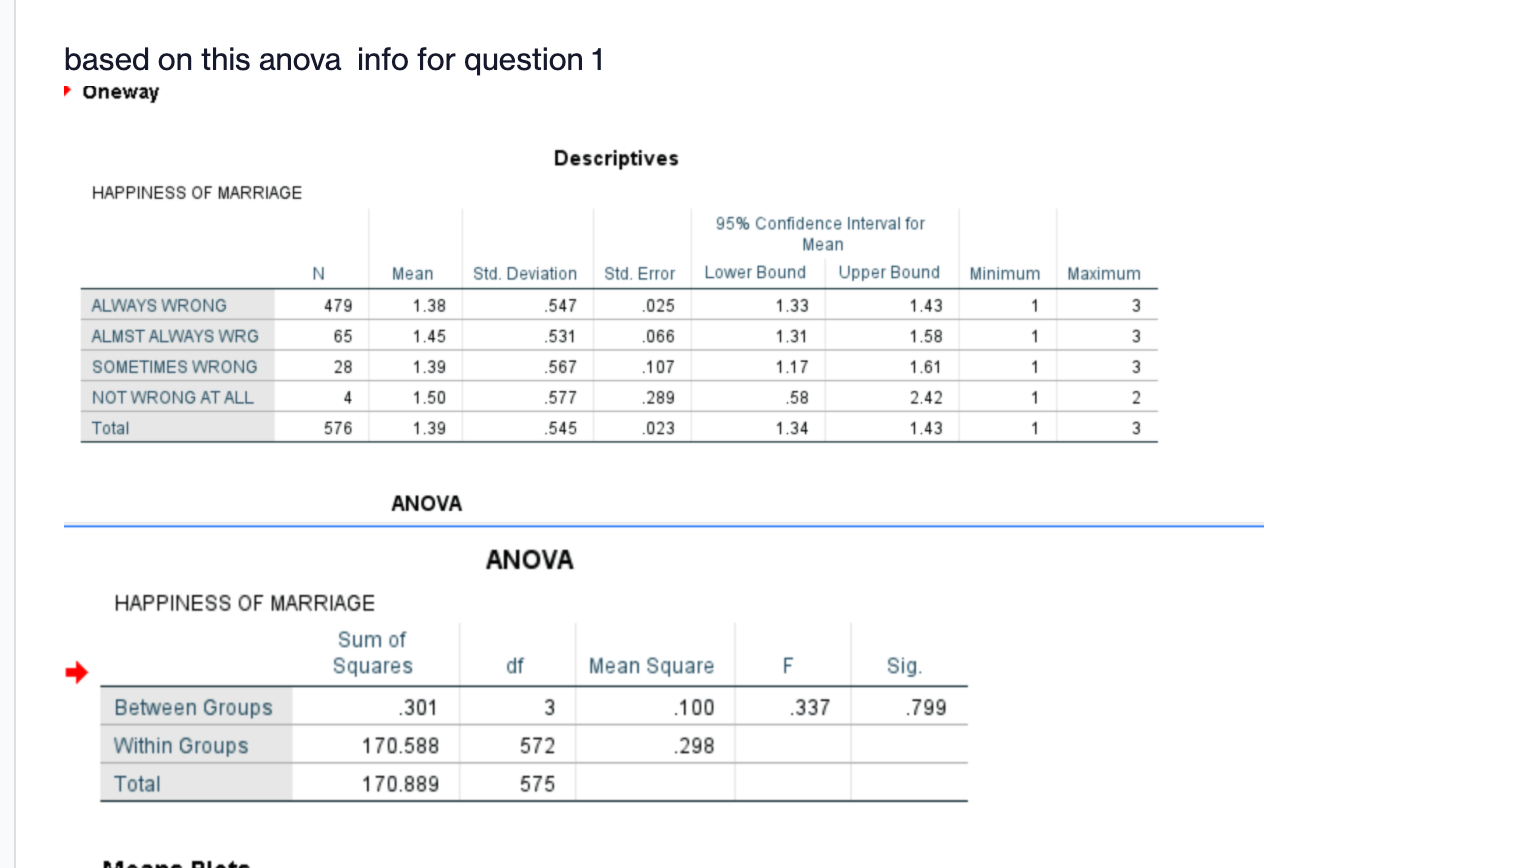
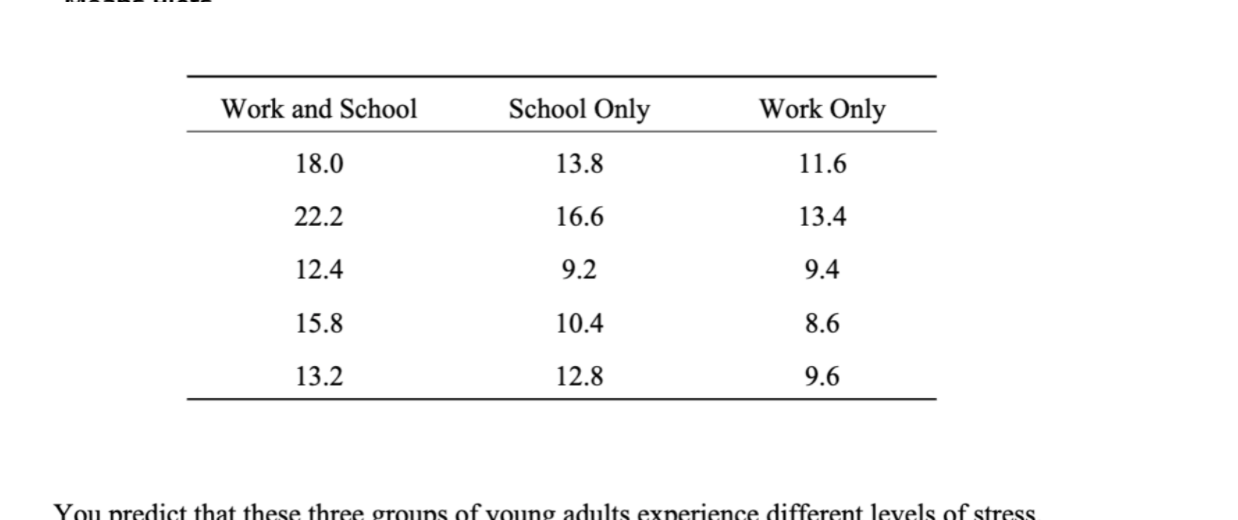
based on this anova info for question 1 Oneway Descriptives HAPPINESS OF MARRIAGE 95% Confidence Interval for Mean N Mean Std. Deviation Std. Error Lower Bound Upper Bound Minimum Maximum ALWAYS WRONG 479 1.38 547 025 1.33 1.43 3 ALMST ALWAYS WRG 65 1.45 531 066 1.31 1.58 3 SOMETIMES WRONG 28 1.39 .567 .107 1.17 1.61 3 NOT WRONG AT ALL 1.50 577 289 .58 2.42 2 Total 576 1.39 545 023 1.34 1.43 1 3 ANOVA ANOVA HAPPINESS OF MARRIAGE Sum of Squares df Mean Square Sig Between Groups 301 3 100 .337 .799 Within Groups 170.588 572 298 Total 170.889 5752. Explain in words what the data for your dependent variable would look like (i.e., how would the values of this variable be distributed) if there was a perfect relationship between your two variables. 3. You are currently conducting research on the effects of school and work on stress. For this research, you collected data on stress levels, measured on a scale from 1 (least stressed) to 25 most stressed. You have data 'om 15 young adults divided into three groups: those who both work and attend college; those who only attend college; and those who only work. Data for the three groups are shown in the table below. 1. Use SPSS and the General Social Survey (GSS) data set provided to the class to perform a hypothesis test about differences in means among three or more groups (or categories) of individuals living in the United States. To perform this analysis of variance, you need to choose variables you are interested in that are appropriate for conducting this type of analysis. Look carefully through the class GSS codebook (available on sakai), decide on two appropriate variables for your analysis, and develop a hypothesis concerning the relationship between these two variables. Use SPSS to run the analysis needed to test your null hypothesis and save the results in your output. (You cannot use the same two variables provided in the example in recitation.) Write up all of the steps to perform your hypothesis test (with an alpha of .01). Be sure to include equations and written statements for the null and alternative hypothesis. Describe your summary conclusion in complete sentences. Work and School School Only Work Only 18.0 13.8 11.6 22.2 16.6 13.4 12.4 9.2 9.4 15.8 10.4 8.6 13.2 12.8 9.6 You predict that these three groups of young adults experience different levels of stress
Step by Step Solution
There are 3 Steps involved in it

Get step-by-step solutions from verified subject matter experts