

Question: Here's the study. The data set that I have given you represents survey results from female prisoners in a minimum security women's prison in Central
Here's the study. The data set that I have given you represents survey results from female prisoners in a minimum security women's prison in Central Illinois. They were administered a survey called the Trauma Symptom Inventory-2 (TSI-2). One of the scales on the instrument is contained in the data set; it assesses anxiety symptoms. The unit of measurement is a T score. A T score on a psychological measurement is different than a T score that is a statistical analysis. A T score on a psychological measurement is a standardized score where the mean is 50 with the standard deviation of 10. When clinicians look at most psychological instruments, they are looking for scores that are 1 1/2 standard deviations above the mean. Those scores are considered clinically significant. In other words, the clinician should see this symptom as an area important for clinical intervention. So a score above 65, is considered to be clinically significant (This is different from a statistical significance.)The grouping variable is a Trauma variable. We create a variable that classified women as having 1 type of trauma (domestic violence OR sexual violence as an adult OR sexual violence as a child); having two (2) of these experiences; or having all three (3).Process:State your null and alternative hypotheses. We are expecting the means to differ under the belief that the more types of trauma a person experiences, the worse the anxiety symptoms.1. What are the null and alternate hypotheses? Ho: __________________________________________________________ H1:___________________________________________________________Because we have more than two groups, we have to run a one-way ANOVA. Go to "Analyze"? "Compare Means"?"One-Way ANOVA." You want to move your dependent variable into the box labeled "Dependent List" and your independent variable into the box labeled "Factor." After you do this, click "Options" and put a check next to "Descriptive Statistics." Click "Continue" and "OK."2. What are the mean scores on anxiety for each of three groups? 1 type: _______________ 2 types: ________________ 3 types: _______________3. What are your degrees of freedom [i.e. df (?, ?)], your F-value, and your p-value? df: _________________ F =__________________ p = ________________4. What do you conclude regarding the null hypothesis assuming we had chosen an alpha level of .05?5. Based solely on this output, are you able to tell which groups are significantly different from one another in terms of anxiety? Why or why not?
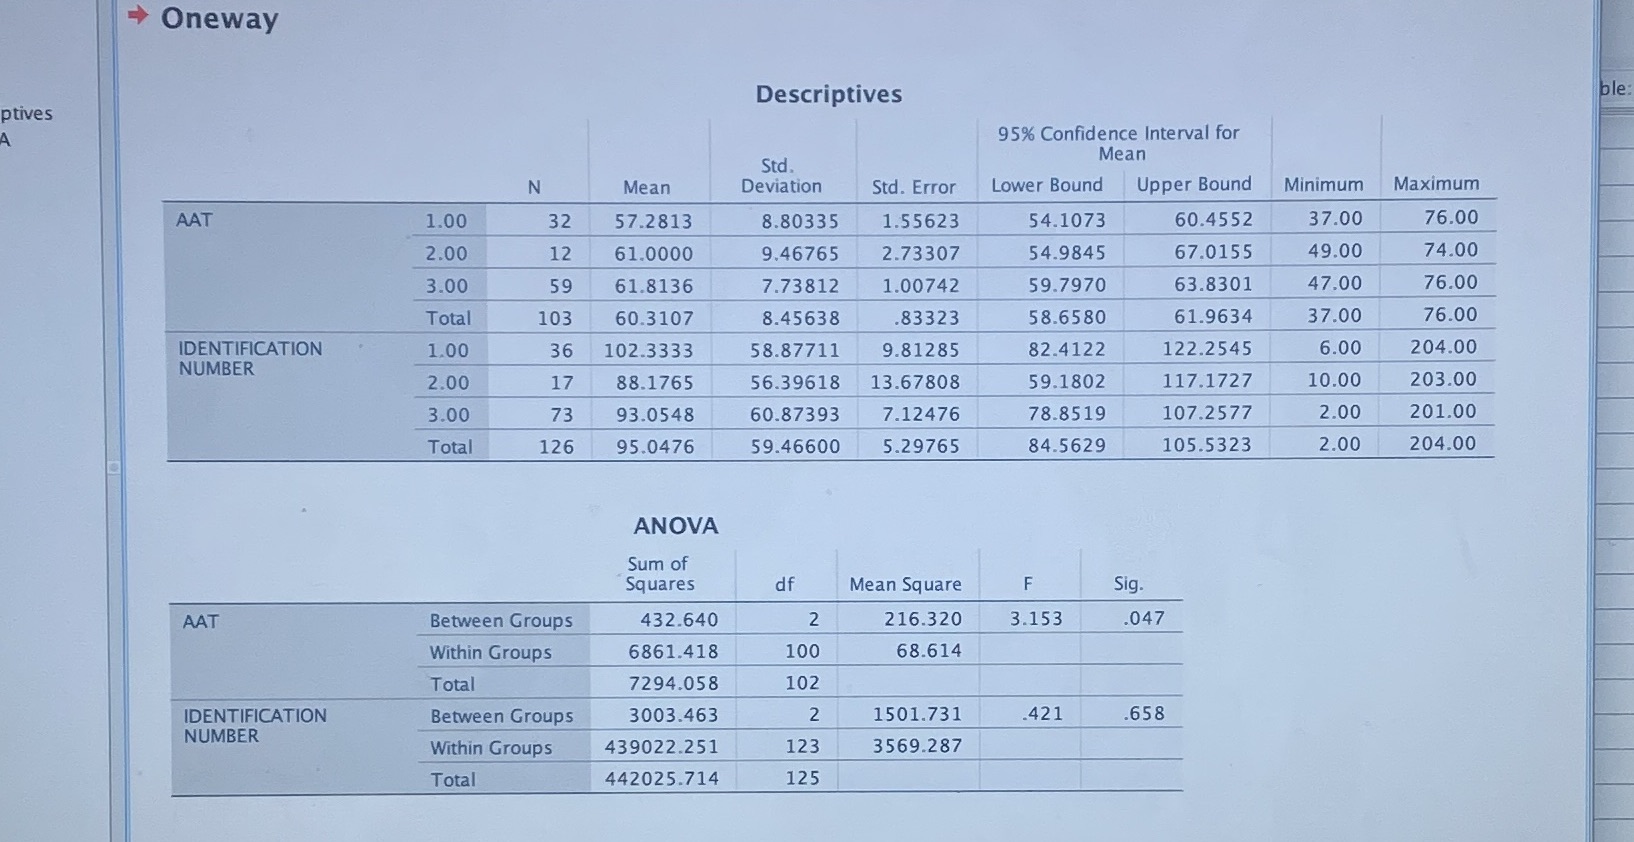
Oneway Descriptives ble ptives 95% Confidence Interval for Std. Mean N Mean Deviation Std. Error Lower Bound Upper Bound Minimum Maximum AAT 1.00 32 57.2813 8.80335 1.55623 54.1073 60.4552 37.00 76.00 2.00 12 61.0000 9.46765 2.73307 54.9845 67.0155 49.00 74.00 3.00 59 61.8136 7.73812 1.00742 59.7970 63.8301 47.00 76.00 Total 103 60.3107 8.45638 83323 58.6580 61.9634 37.00 76.00 IDENTIFICATION 1.00 36 102.3333 58.87711 9.81285 82.4122 122.2545 6.00 204.00 NUMBER 2.00 17 88.1765 56.39618 13.67808 59.1802 117.1727 10.00 203.00 3.00 73 93.0548 60.87393 7.12476 78.8519 107.2577 2.00 201.00 Total 126 95.0476 59.46600 5.29765 84.5629 105.5323 2.00 204.00 ANOVA Sum of Squares df Mean Square F Sig. AAT Between Groups 432.640 2 216.320 3.153 .047 Within Groups 6861.418 100 68.614 Total 7294.058 102 IDENTIFICATION Between Groups 3003.463 2 1501.731 421 658 NUMBER Within Groups 439022.251 123 3569.287 Total 442025.714 125
Step by Step Solution
There are 3 Steps involved in it

Get step-by-step solutions from verified subject matter experts