

Question: 1st step with this data make an table using the spearman rank - order it should look just like table 8.2 in the attachment start
1st step with this data make an table using the spearman rank - order it should look just like table 8.2 in the attachment
start from highest to lowest
x = 27,28,29,30,29,30,28,27
y= 11,12,13,14,14,14,11,12
Then solve for rs using the spearman rank formula (the formula is in the attachment provided)
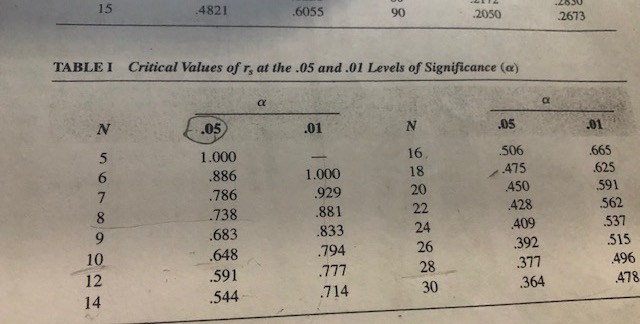
after that test the hypothesis using the critical value of rs table and only using the 0.5 column ( table provided attached )
I am uploading the critical value table to use to test the hypothesis
and I will upload an example of the spearman rank order table
PLEASE SHOW ME STEP-BY-STEP
ESPECIALLY STEP-BY-STEP ON HOW TO TEST THE HYPOTHESIS.
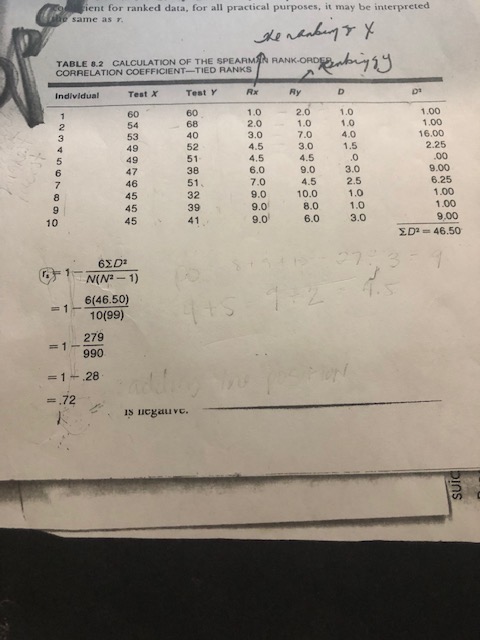
same as r. ient for ranked data, for all practical purposes, it may be interpreted TABLE 0.2 CALCULATION OF THE SPEARMAN RANK-ORDERSby 5 CORRELATION COEFFICIENT-TIED RANKS Individual Test X Test Y Rx AY D 60 60 1.0 54 68 2.0 1.0 2.0 1.0 1.00 53 1.0 40 3.0 7.0 1,00 40 49 52 4.5 3.0 16,00 1.5 49 51 4.5 4.5 2.25 47 38 6.0 46 9.0 3.0 51, 7.0 9.00 4.5 45 2.5 32 6.25 9.0 45 10.0 1.0 39 9.0 1.00 80 1.0 45 1.00 41 9.0 6.0 3.0 9.00 ED = 46.50 630: N(N - 1) 8 1 =1 6(46.50) 10(99) = 1 279 990 =1 -.28. =.72 ne position IS negauve. SUIC15 4821 .6055 90 .2050 2673 TABLE I Critical Values of r, at the .05 and .01 Levels of Significance (o) CE LE .05 .01 N .05 .01 1.000 16 .506 .665 886 1.000 18 .475 .625 786 .929 20 .450 .591 738 881 22 .428 562 683 .833 24 409 537 10 648 .794 26 .392 515 12 .591 777 28 .377 496 14 .544 714 30 364 478
Step by Step Solution
There are 3 Steps involved in it

Get step-by-step solutions from verified subject matter experts