

Question: - . 1t: Copy and paste all requested output for full credit. I Open the Internship dataset. The data shown was recorded for 1461 recent
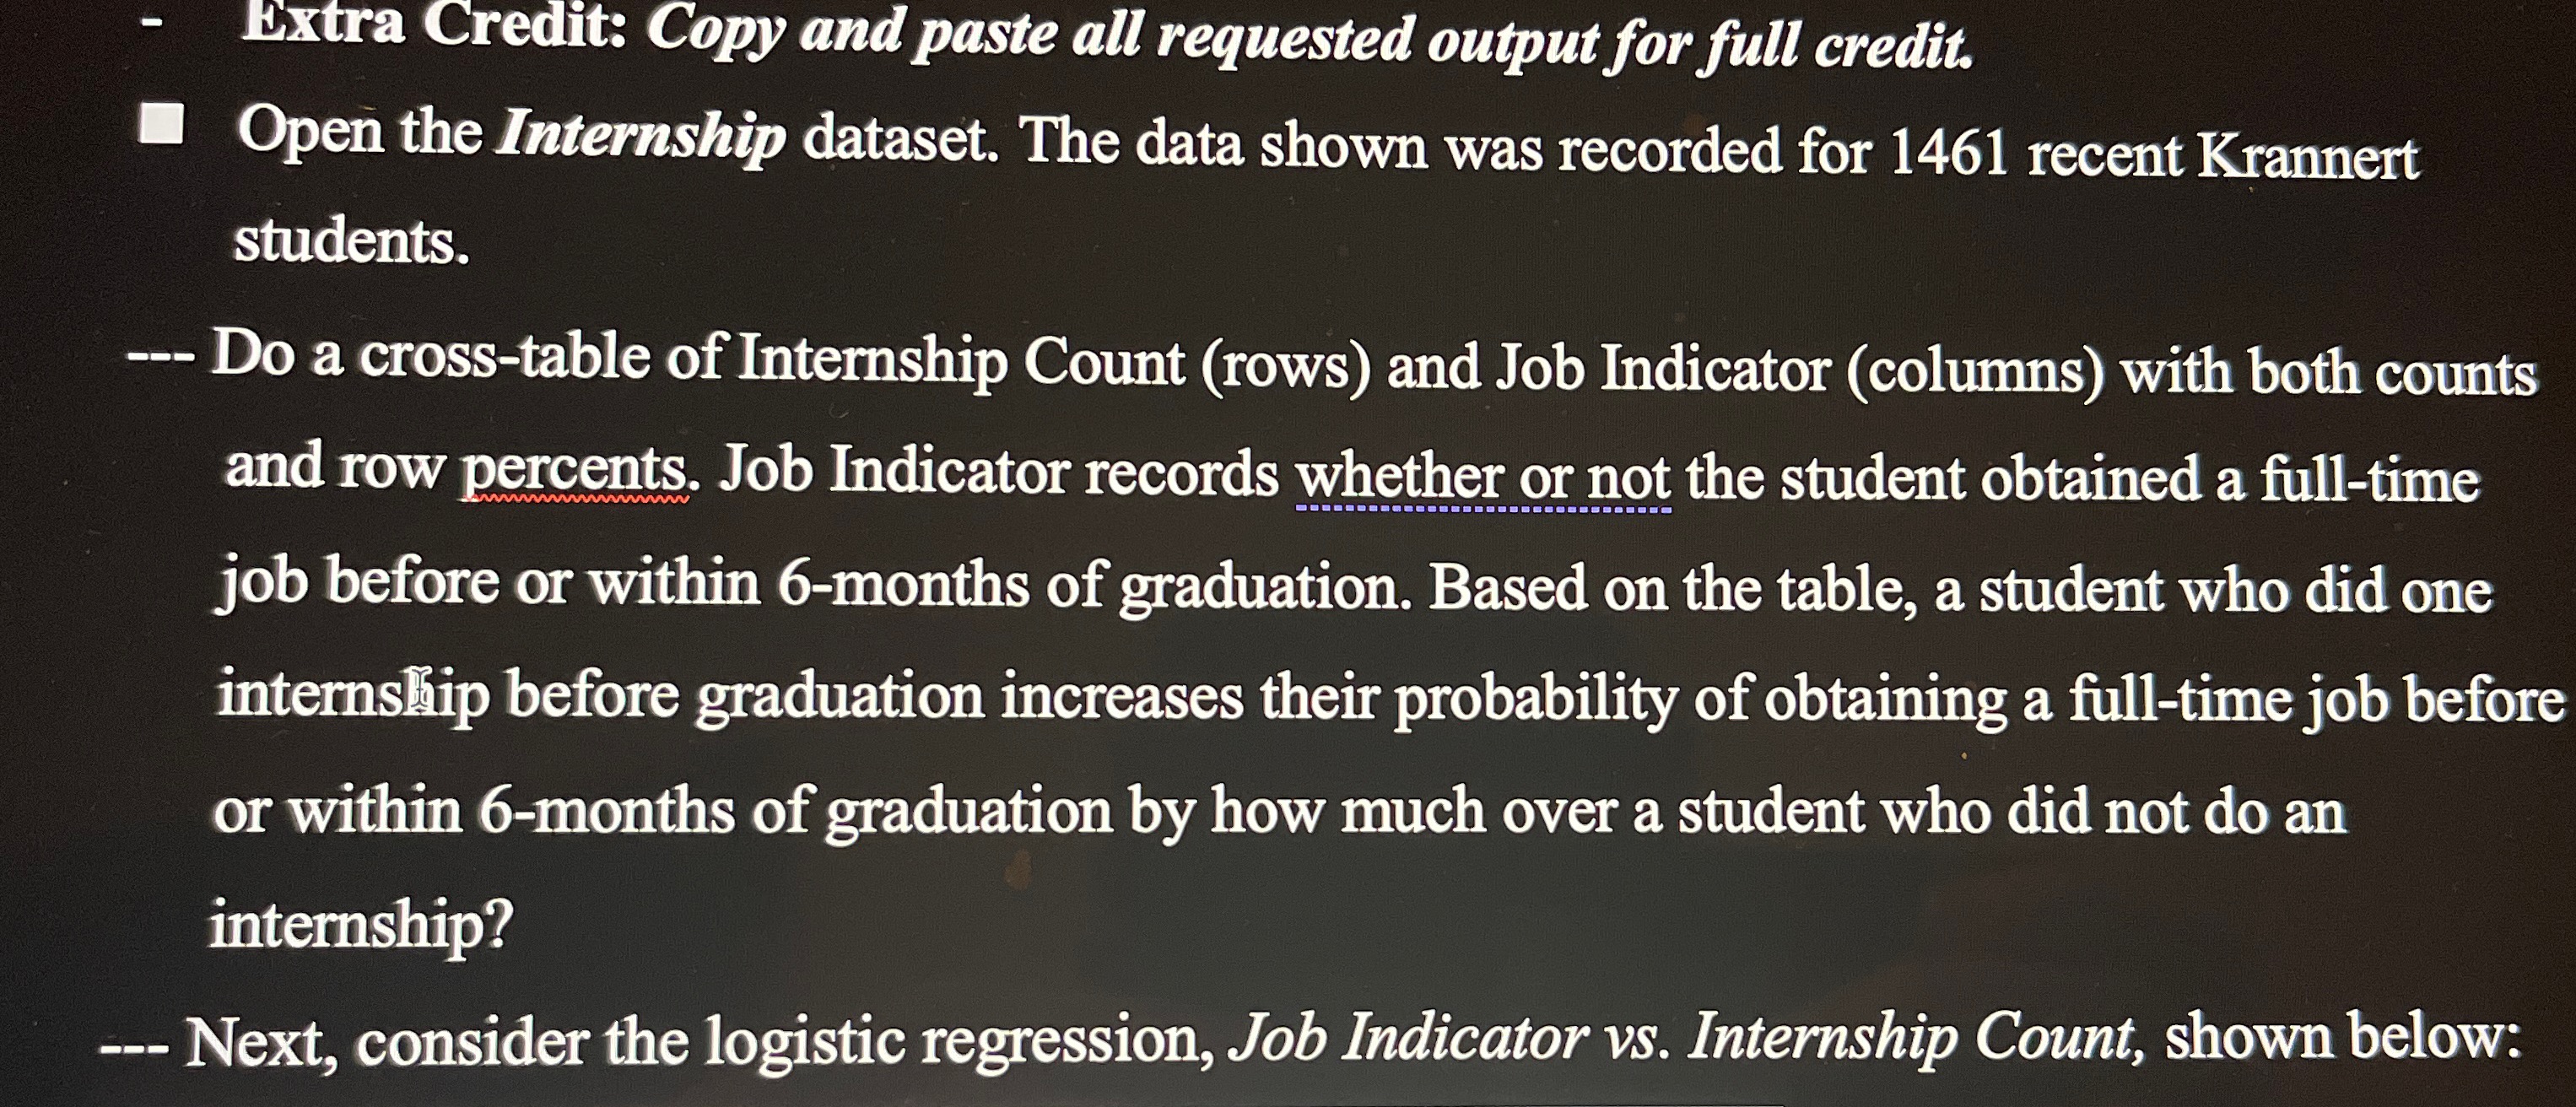
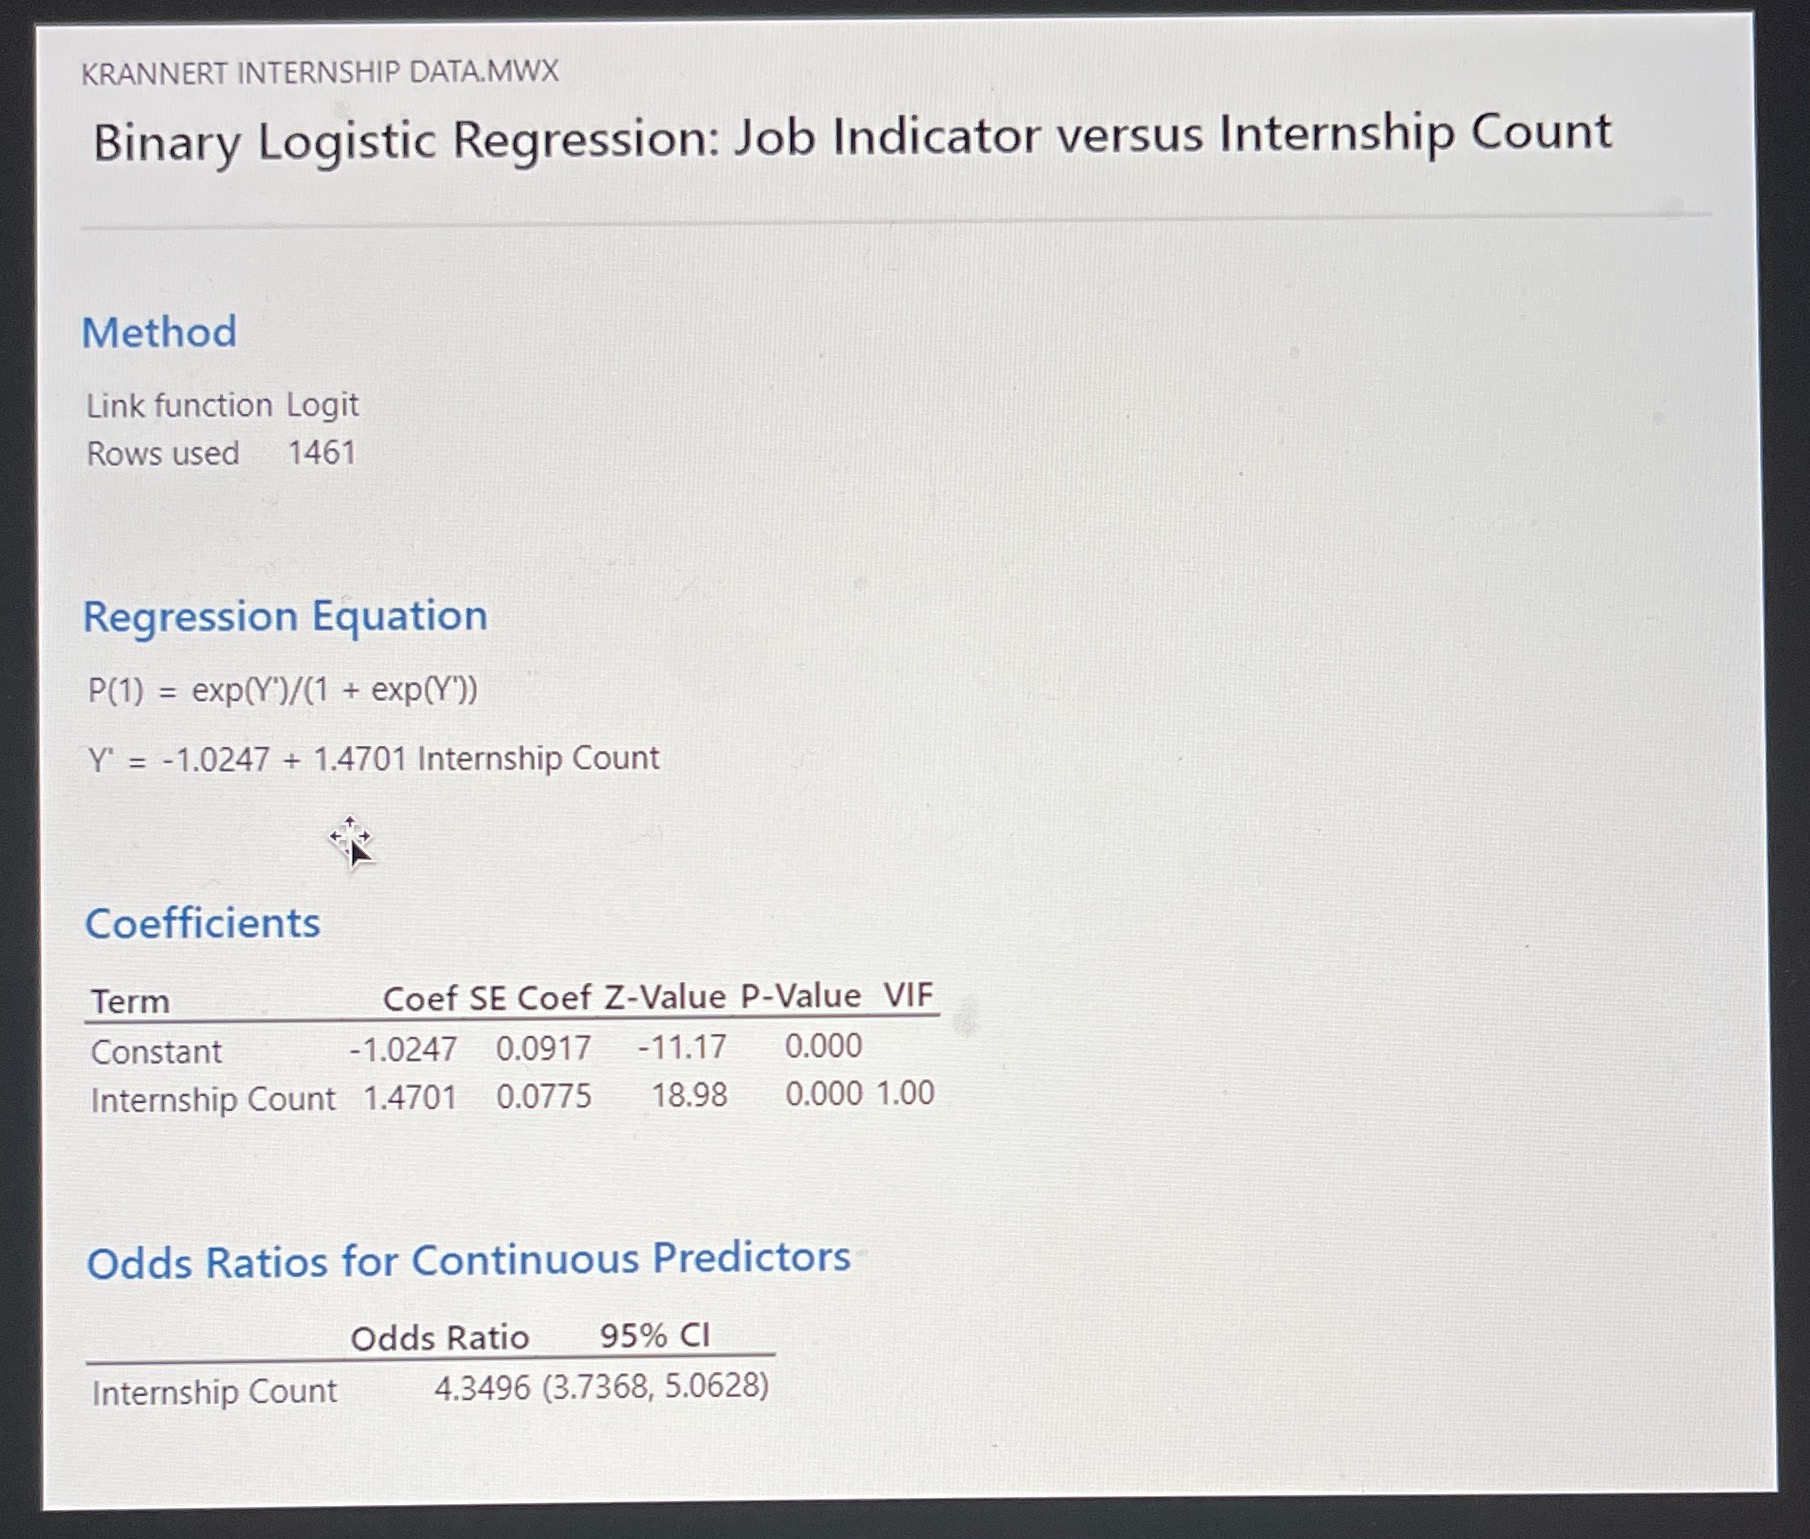


- . 1t: Copy and paste all requested output for full credit. I Open the Internship dataset. The data shown was recorded for 1461 recent Krannert students. -- Do a cross-table of Internship Count (rows) and Job Indicator (columns) with both counts and row percents. Job Indicator records whether or not the student obtained a full-time job before or within 6-months of graduation. Based on the table, a student who did one intemsip before graduation increases their probability of obtaining a full-time job before or within 6-months of graduation by how much over a student who did not do an internship? --- Next, consider the logistic regression, Job Indicator vs. Intemship Count, shown below: \f--- Using this model, predict the probability of nding a job for a student who did no mtemship and a student who did one. (Use software or calculate by hand.) How does the difference compare to the sample difference found from the cross-table? How might this be explained? Is the difference statistically signicant at the 5% level? Briey explain. --- Research Question: In logistic regression, coefcients are not found using the least squares method. What is the name of the method that is used
Step by Step Solution
There are 3 Steps involved in it

Get step-by-step solutions from verified subject matter experts