

Question: 1.Use graphing software to create a graph of Applied Force on the vertical axis versus displacement on the horizontal axis for the data collected when
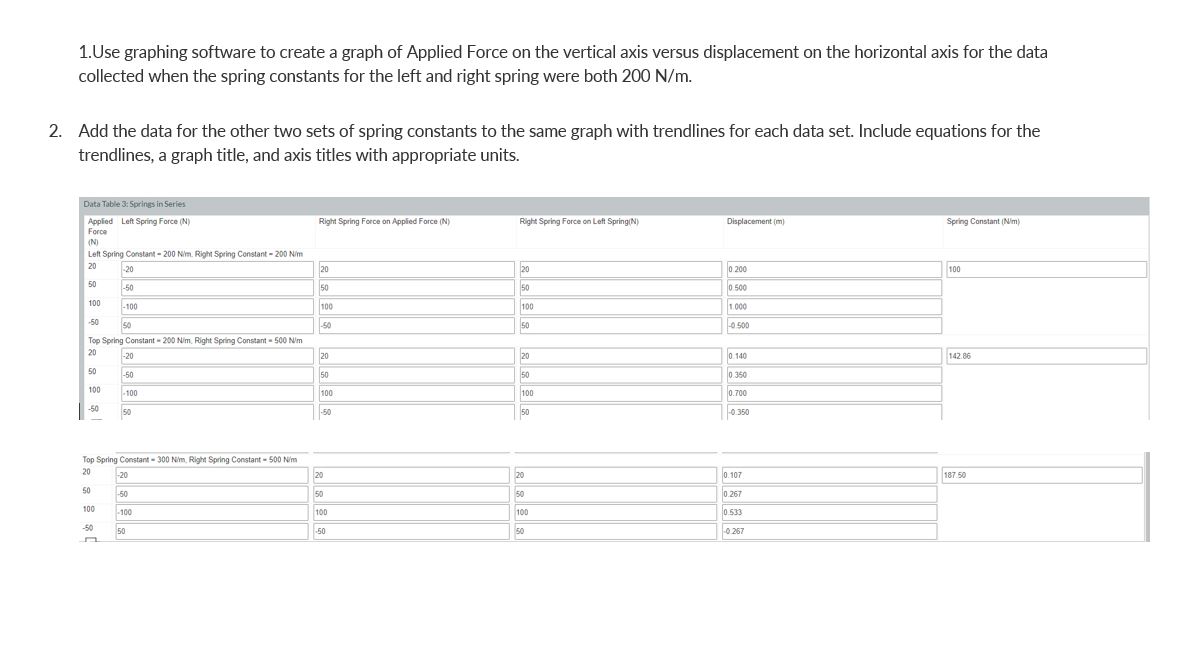
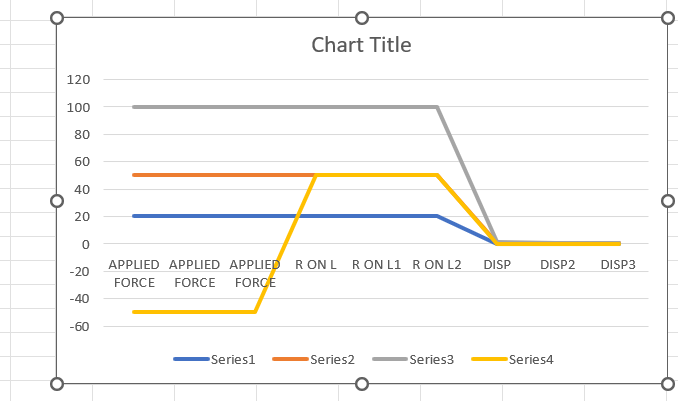
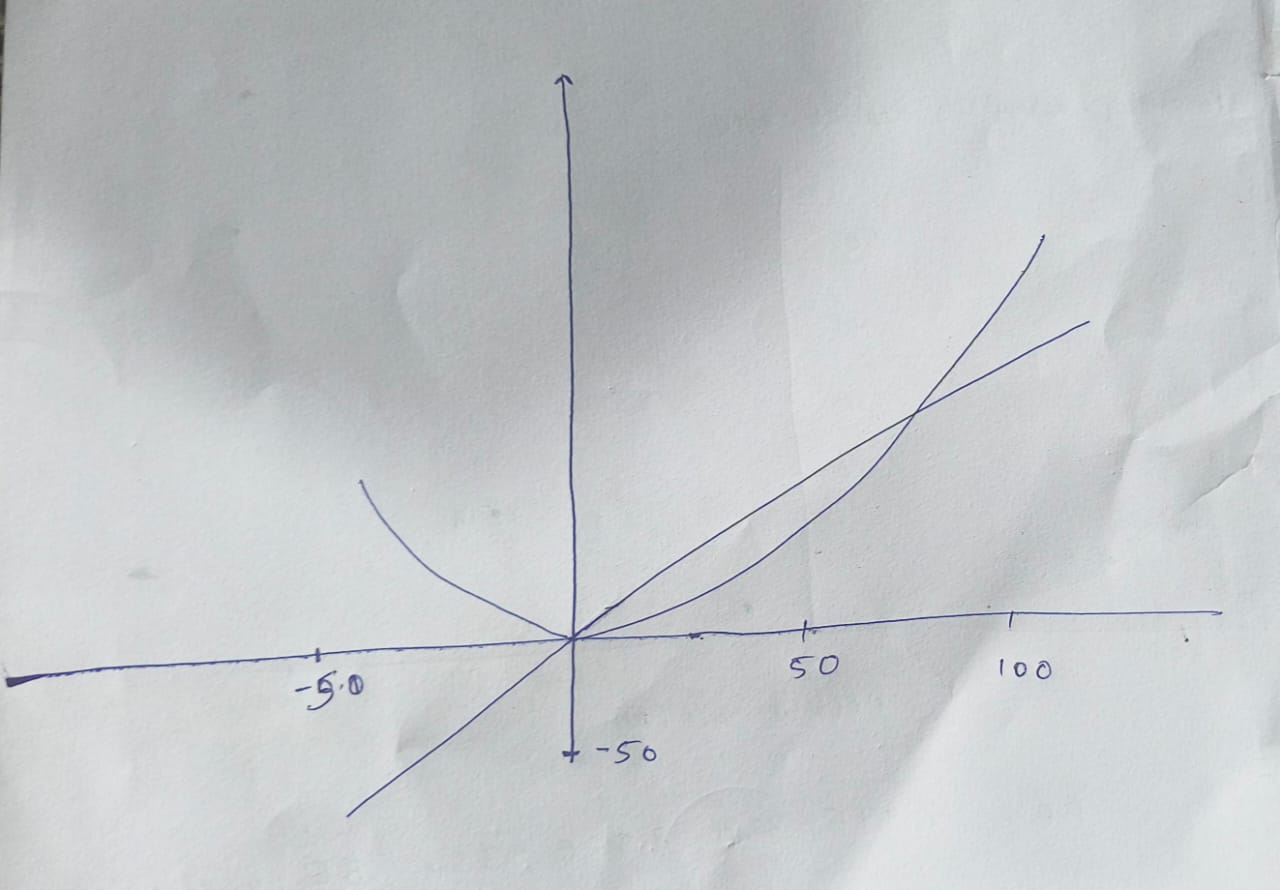
1.Use graphing software to create a graph of Applied Force on the vertical axis versus displacement on the horizontal axis for the data collected when the spring constants for the left and right spring were both 200 N/m. 2. Add the data for the other two sets of spring constants to the same graph with trendlines for each data set. Include equations for the trendlines, a graph title, and axis titles with appropriate units. Data Table 3: Springs in Series Applied Left Spring Force (N) Right Spring Force on Applied Force (N) Right Spring Force on Left Spring(N) Displacement [m) Spring Constant (Nim) Force Left Spring Constant - 200 Nim. Right Spring Constant - 200 Nim 20 -20 20 20 0.200 100 -50 50 50 0 500 100 -100 100 100 1.000 -50 50 0.50 Top Spring Constant - 200 Nim. Right Spring Constant = 500 N'm 20 -20 20 20 0 140 142.86 50 0.350 100 -100 100 100 0.700 50 150 1:50 150 0 350 Top Spring Constant = 300 Nim, Right Spring Constant - 500 Nim 20 -20 20 20 0.107 187.50 50 50 10.267 100 -100 10D 100 0.533 50 50 -0 267O O O Chart Title 120 100 80 60 40 O O 20 0 -20 APPLIED APPLIED APPLIED RONL RONL1 R ON L2 DISP DISP2 DISP3 FORCE FORCE FORCE -40 -60 Series1 Series2 Series3 Series4 O O O- 50 50 100 +-50
Step by Step Solution
There are 3 Steps involved in it

Get step-by-step solutions from verified subject matter experts