

Question: 1.Use the bearish case assumptions for this DCF question. First, estimate the net operating profit after tax (NOPAT) forecast for 2012, 2013, 2014, and 2015.
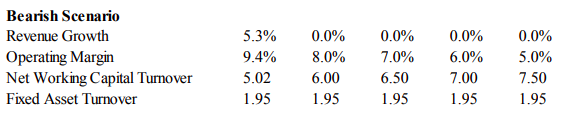
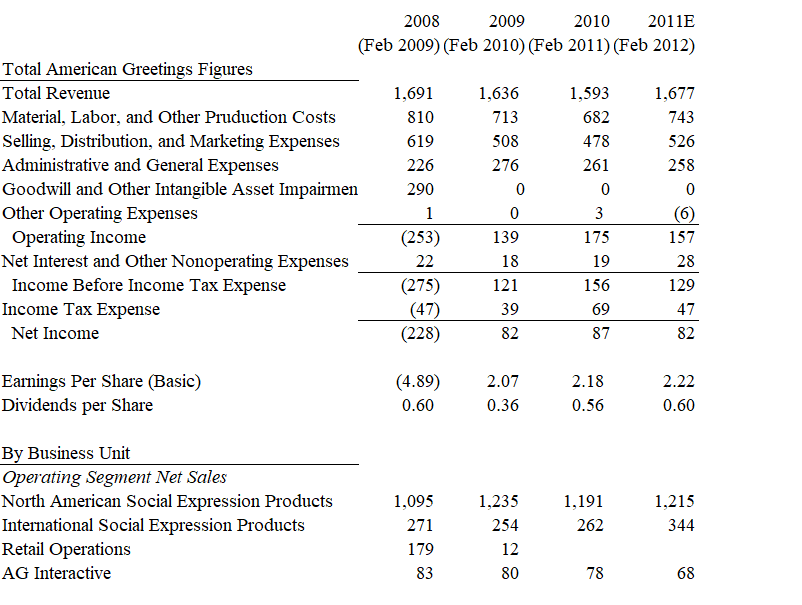
1.Use the bearish case assumptions for this DCF question. First, estimate the net operating profit after tax (NOPAT) forecast for 2012, 2013, 2014, and 2015. Revenue Growth and Operating Margin are provided in Exhibit 8. Use a tax rate of 39%. The NOPAT is $82 in 2012, $____ in 2013, __________ in 2014 and ____________ in 2015.
Group of answer choices
a.$82 in 2013, $82 in 2014 and $82 in 2015
b.$69 in 2013, $58 in 2014 and $48 in 2015
c.$82 in 2013, $81 in 2014 and $80 in 2015
d.$72 in 2013, $61 in 2014 and $51 in 2015
2.
Use the bearish case assumptions for this DCF question. Next, estimate the Free Cash Flow (defined as NOPAT minus the change in working capital minus the net change in net assets) for 2012, 2013, 2014, and 2015. Calculate Net Working Capital (NWC) using the projected NWC turnover ratios in the case (where NWC turnover = Revenue/NWC). Calculate the depreciation and capital expenditures as the change in Net Fixed Assets. Fixed Assets can be projected using the Fixed Asset Turnover ratios provided in the case (where FA turnover = Revenue/Assets). The Free Cash flow is $136 in 2012, $93 in 2013, $________ in 2014, and $_______ in 2015.
Group of answer choices
a.$80 in 2014, and $67 in 2015
b.$94 in 2014, and $96 in 2015
c.$93 in 2014, and $93 in 2015
d.$121 in 2014, and $130 in 2015
3.
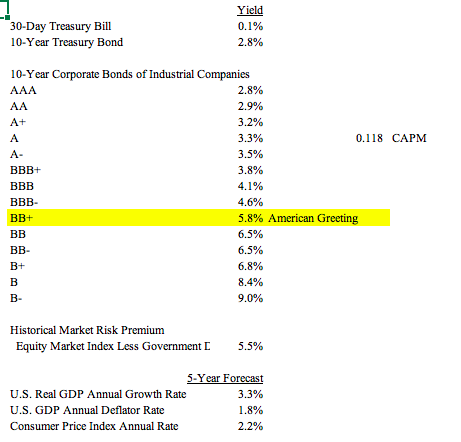
Use the bearish case assumptions for this DCF question. Third, estimate the terminal value of the firm using the steady state growth model (terminal value = Steady State FCF/(WACC Revenue Growth Rate)). Assume the 2015 growth, margin and turnover rates in Exhibit 8 are also the steady state rates to project the Steady State FCF. Use the previously calculated WACC in 2011. The steady state Revenue Growth Rate is equal to the 2015 revenue growth rate. The calculated terminal value of the firm is _________.
Group of answer choices
a.$565
b.$334
c.$1,111
d.$447
3.
Use the bearish case assumptions for this DCF question. Calculate the enterprise value of the firm using the discount present value of the projected FCF and terminal value.
Group of answer choices
a.$447
b.$1,100
c.$712
d.$235
4.
Use the bearish case assumptions for this DCF question. Calculate the implied share price using the enterprise value, the book value of debt and number of shares outstanding in 2011 in the case.
Group of answer choices
a.$11.51
b.$14.79
c.$12.45
d.$23.07
5.Considering the share price you calculated in the bearish case, is the American Greetings share price overvalued, undervalued or fairly valued?
Bearish Scenario 0.0% Revenue Growth 5.3% 0.0% 0.0% 0.0% Operating Margin Net Working Capital Tumover Fixed Asset Turnover 9.4% 8.0% 7.0% 6.0% 5.0% 5.02 6.00 6.50 7.00 7.50 1.95 1.95 1.95 1.95 1.95 2009 2011E 2008 2010 (Feb 2009) (Feb 2010) (Feb 2011) (Feb 2012) Total American Greetings Figures Total Revenue 1,593 1,691 1,636 1,677 Material, Labor, and Other Pruduction Costs 713 682 810 743 Selling, Distribution, and Marketing Expenses Administrative and General Expenses Goodwill and Other Intangible Asset Impairmen Other Operating Expenses 508 619 478 526 226 276 261 258 290 10 0 0 (6) 1 0 Operating Income Net Interest and Other Nonoperating Expenses Income Before Income Tax Expense Income Tax Expense (253) 139 175 157 22 18 19 28 (275) (47) (228) 121 156 129 39 69 47 Net Income 82 87 82 Earnings Per Share (Basic) Dividends per Share (4.89) 2.07 2.18 2.22 0.60 0.36 0.56 0.60 By Business Unit Operating Segment Net Sales North American Social Expression Products International Social Expression Products Retail Operations 1,215 1,095 1,235 1,191 254 262 271 344 179 12 80 AG Interactive 83 78 68 Operating Segment Earnings North American Social Expression Products International Social Expression Products Retail Operations AG Interactive 236 70 218 148 (78) (19) (162) 17 20 20 (35) 11 14 14 Total Revenue by Product Category Everyday Greeting Cards Seasonal Greeting Cards Gift Packaging 704 764 753 823 369 357 377 408 240 221 223 239 Other Revenue 44 38 32 32 All Other Products 345 244 207 176 Yield 30-Day Treasury Bill 0.1% 10-Year Treasury Bond 2.8% 10-Year Corporate Bonds of Industrial Companies AAA 2.8% AA 2.9% A+ 3.2% A 3.3% 0.118 - 3.5% BB+ 3.8% 4.1% B- 4.6% 5.8% American Greeting BB+ 6.5% - 6.5% B+ 6.8% 8.4% . 9.0% Historical Market Risk Premium Equity Market Index Less Government 5.5% 5-Year Forecast 3.3% U.S. Real GDP Annual Growth Rate U.S. GDP Annual Deflator Rate 1.8% 2.2% Consumer Price Index Annual Rate Bearish Scenario 0.0% Revenue Growth 5.3% 0.0% 0.0% 0.0% Operating Margin Net Working Capital Tumover Fixed Asset Turnover 9.4% 8.0% 7.0% 6.0% 5.0% 5.02 6.00 6.50 7.00 7.50 1.95 1.95 1.95 1.95 1.95 2009 2011E 2008 2010 (Feb 2009) (Feb 2010) (Feb 2011) (Feb 2012) Total American Greetings Figures Total Revenue 1,593 1,691 1,636 1,677 Material, Labor, and Other Pruduction Costs 713 682 810 743 Selling, Distribution, and Marketing Expenses Administrative and General Expenses Goodwill and Other Intangible Asset Impairmen Other Operating Expenses 508 619 478 526 226 276 261 258 290 10 0 0 (6) 1 0 Operating Income Net Interest and Other Nonoperating Expenses Income Before Income Tax Expense Income Tax Expense (253) 139 175 157 22 18 19 28 (275) (47) (228) 121 156 129 39 69 47 Net Income 82 87 82 Earnings Per Share (Basic) Dividends per Share (4.89) 2.07 2.18 2.22 0.60 0.36 0.56 0.60 By Business Unit Operating Segment Net Sales North American Social Expression Products International Social Expression Products Retail Operations 1,215 1,095 1,235 1,191 254 262 271 344 179 12 80 AG Interactive 83 78 68 Operating Segment Earnings North American Social Expression Products International Social Expression Products Retail Operations AG Interactive 236 70 218 148 (78) (19) (162) 17 20 20 (35) 11 14 14 Total Revenue by Product Category Everyday Greeting Cards Seasonal Greeting Cards Gift Packaging 704 764 753 823 369 357 377 408 240 221 223 239 Other Revenue 44 38 32 32 All Other Products 345 244 207 176 Yield 30-Day Treasury Bill 0.1% 10-Year Treasury Bond 2.8% 10-Year Corporate Bonds of Industrial Companies AAA 2.8% AA 2.9% A+ 3.2% A 3.3% 0.118 - 3.5% BB+ 3.8% 4.1% B- 4.6% 5.8% American Greeting BB+ 6.5% - 6.5% B+ 6.8% 8.4% . 9.0% Historical Market Risk Premium Equity Market Index Less Government 5.5% 5-Year Forecast 3.3% U.S. Real GDP Annual Growth Rate U.S. GDP Annual Deflator Rate 1.8% 2.2% Consumer Price Index Annual Rate
Step by Step Solution
There are 3 Steps involved in it

Get step-by-step solutions from verified subject matter experts