

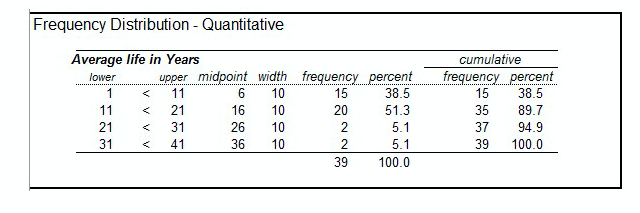
Question: 1.Use the distribution data, draw a histogram to display the distribution of The average Life in Years. f
1.Use the distribution data, draw a histogram to display the distribution of "The average Life in Years".
\f
Step by Step Solution
There are 3 Steps involved in it
1 Expert Approved Answer
Step: 1 Unlock

Question Has Been Solved by an Expert!
Get step-by-step solutions from verified subject matter experts
Step: 2 Unlock
Step: 3 Unlock