

Question: 1.Using the information in this note and in the Excel file put forward your analysis of the relationship between unemployment and inflation. You should put
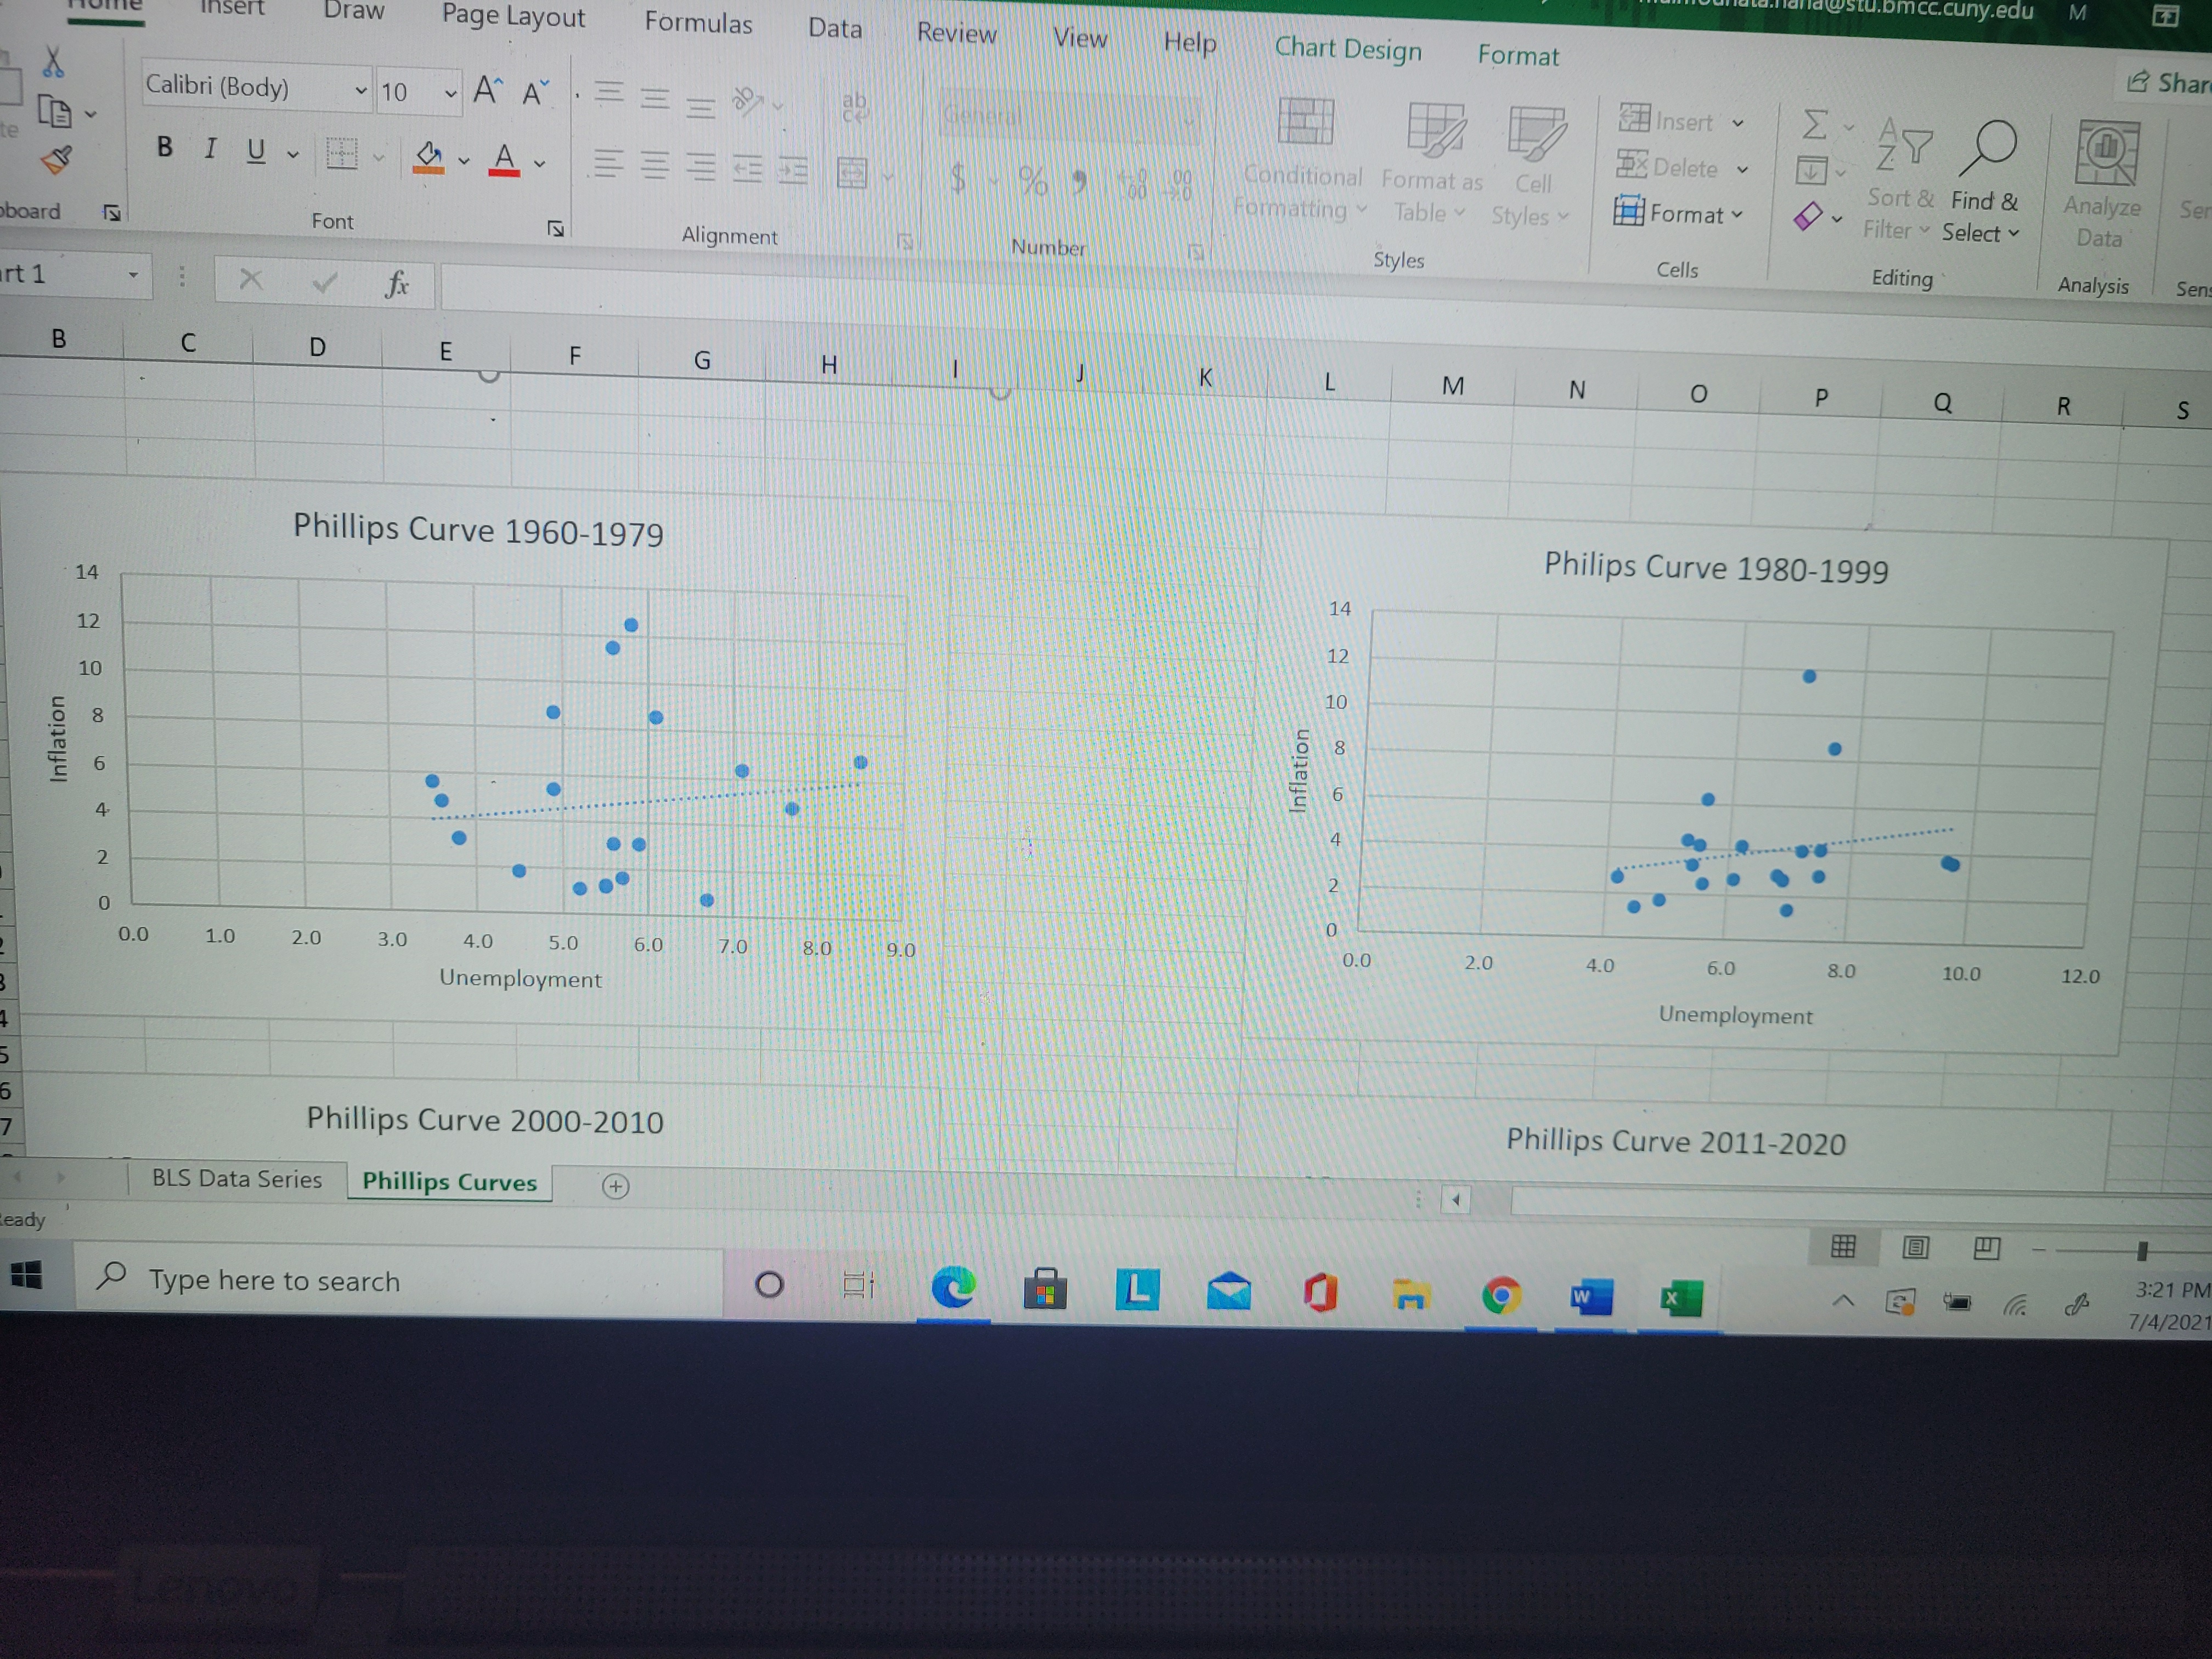
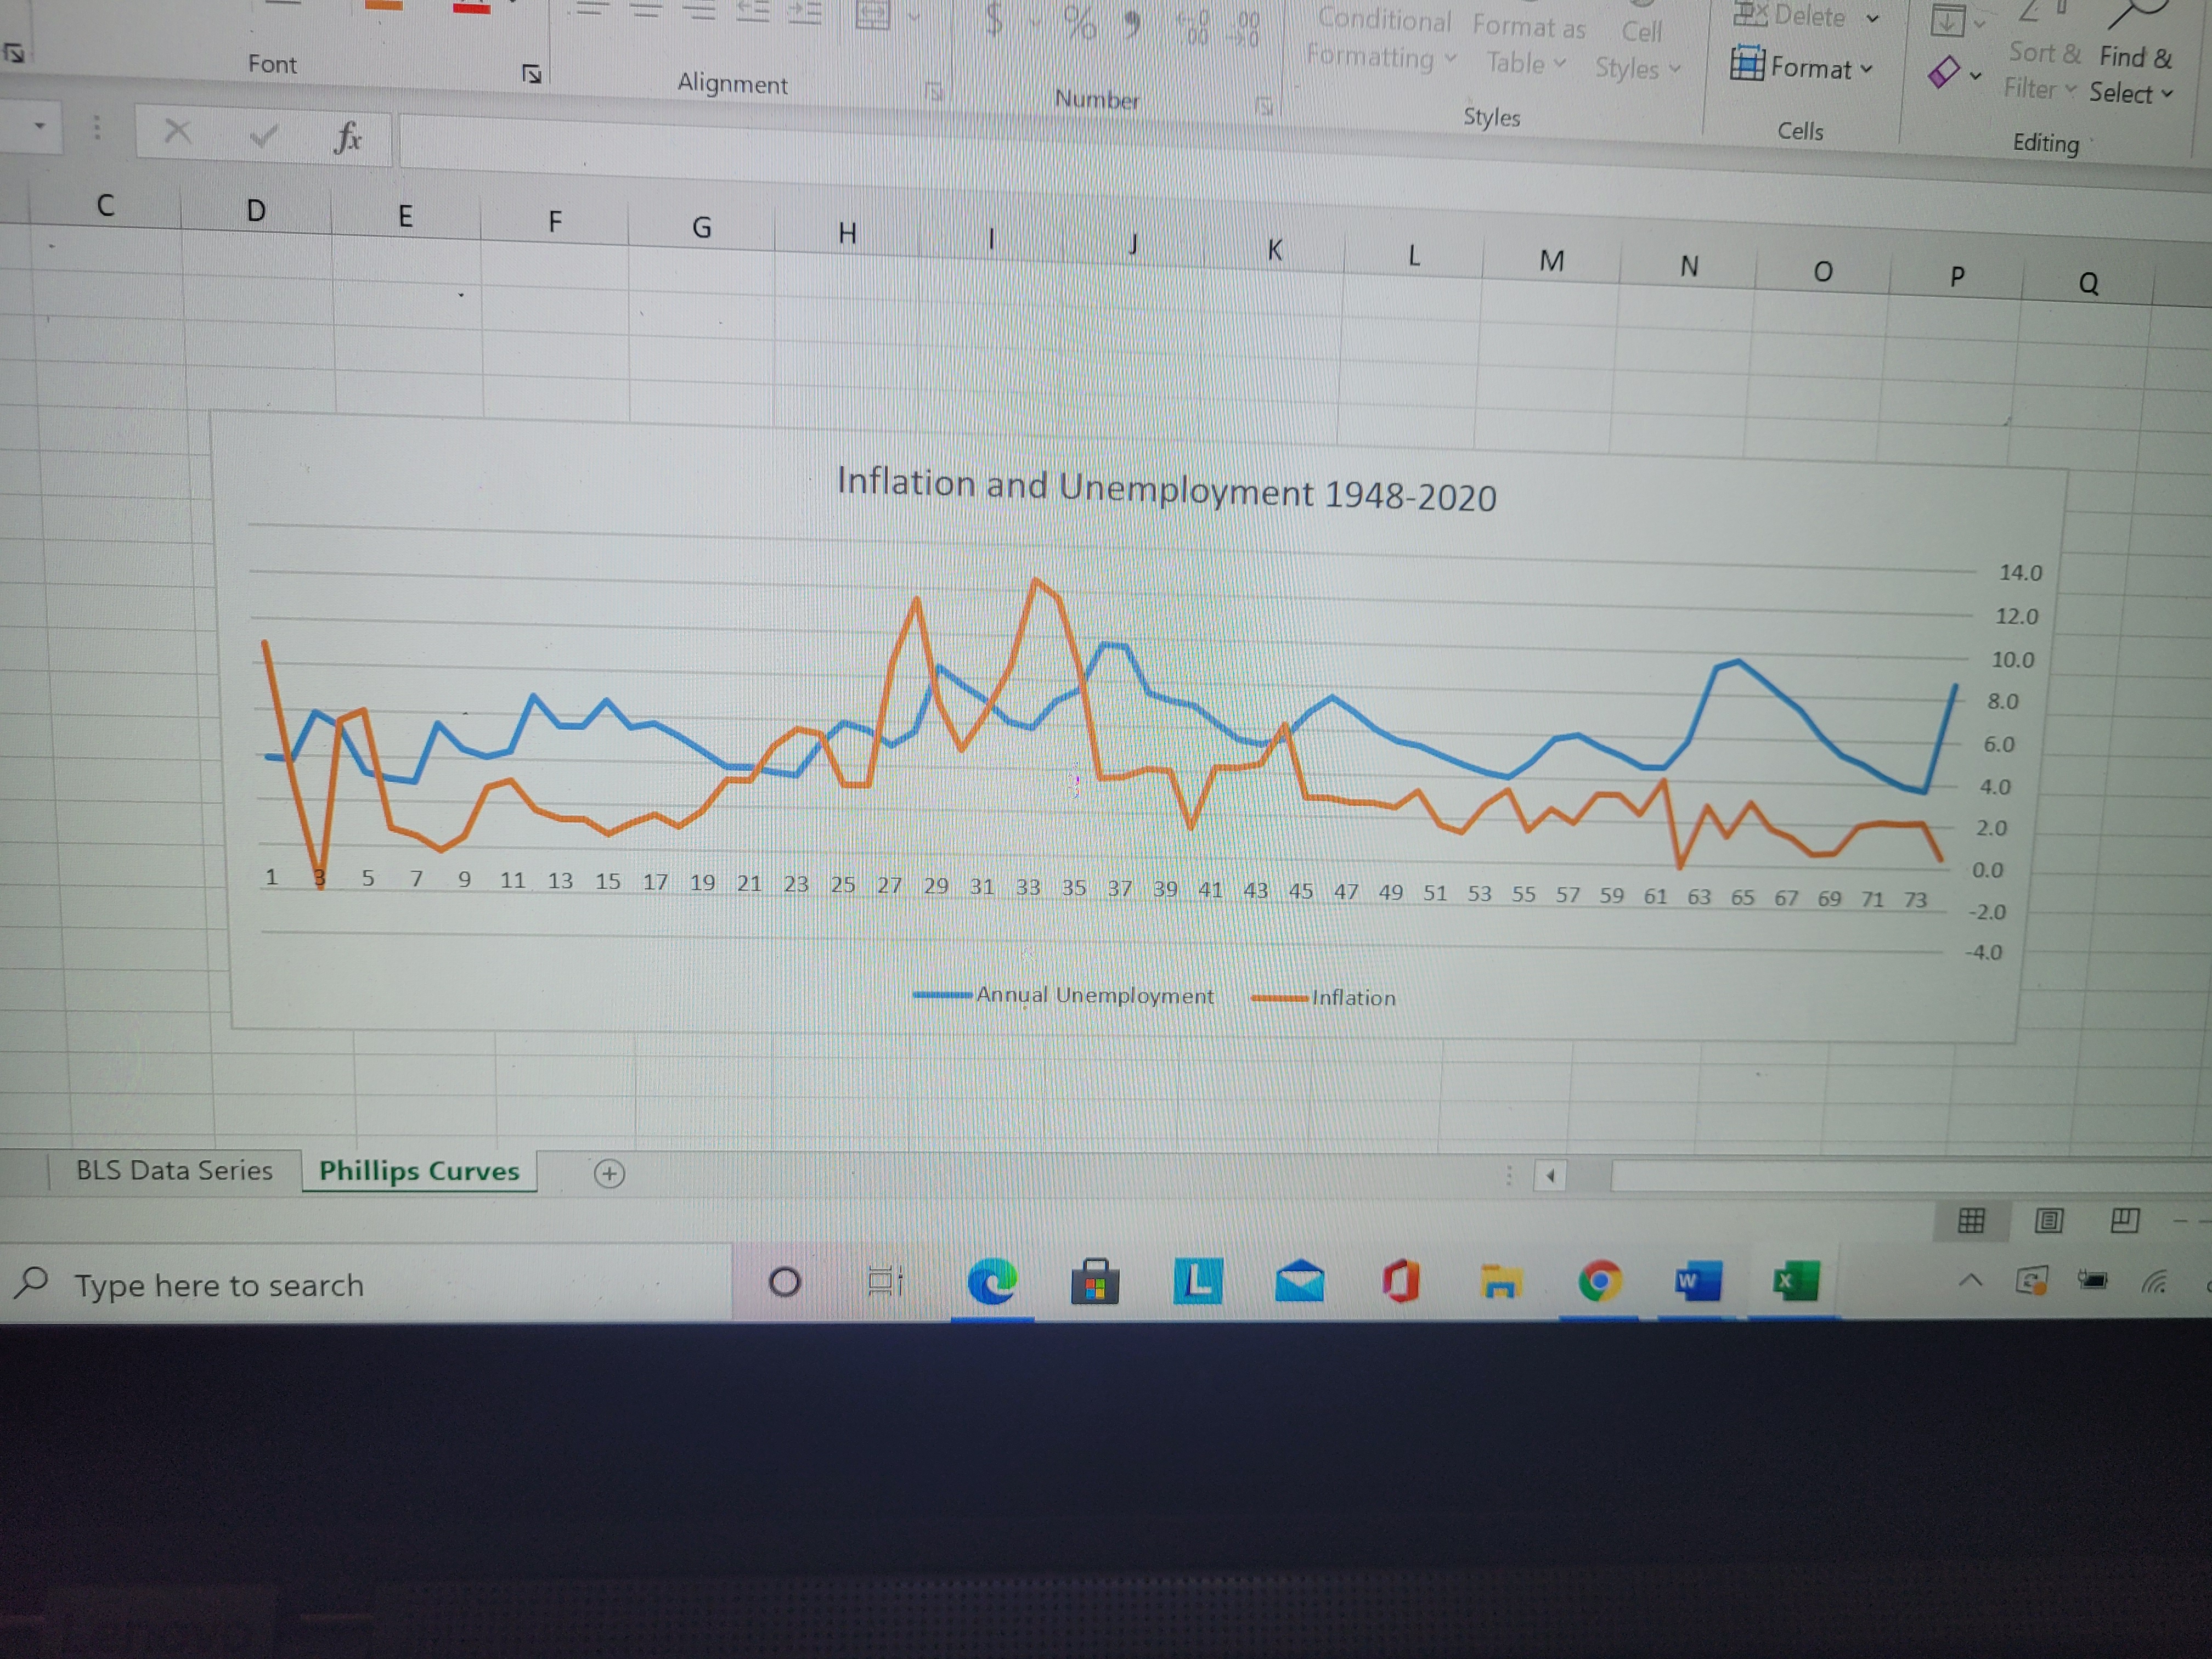
1.Using the information in this note and in the Excel file put forward your analysis of the relationship between unemployment and inflation. You should put forward arguments that are both for and against the Phillips Hypothesis paying attention to the results for 1947-2020, 1947-1959, 1960-1979, 1980-1999, 2000-2010 and 2011-2020.
You are free to use any of the charts or graphs in your paper

bmcc.cuny.edu Draw Page Layout Formulas Data Review View Help Chart Design Format E Shar Calibri (Body) - 10 ~ A A Insert E- AP O Delete B I U - MAY onditional Format as Cell Sort & Find & Format Analyze Matting ~ Table ~ Styles Filter ~ Select Data board Font Alignment Number Styles Cells Editing Analysis Sen rt 1 X fix B C D E F G H L M N O P Q R S Phillips Curve 1960-1979 Philips Curve 1980-1999 14 14 12 10 10 Inflation Inflation N ON O 6.0 8.0 10.0 12.0 0.0 1.0 2.0 3.0 4.0 5.0 6.0 7.0 8.0 9.0 0.0 2.0 4.0 Unemployment Unemployment Phillips Curve 2000-2010 Phillips Curve 2011-2020 BLS Data Series Phillips Curves + leady 3:21 PM O Efl W X Type here to search 7/4/202Insert v E E AP O Delete BIUV ditional Format as Cell Sort & Find & Analyze letting Table ~ Styles Format Filter ~ Select Data bard Font Alignment Number Styles Cells Editing Analysis 1 X fix C D E F G H K L M N O P Q R S Phillips Curve 2000-2010 Phillips Curve 2011-2020 4.5 3.5 A 3 3.5 . . 2.5 3 .. . 2.5 . . . . .. .... Inflation 1.5 Inflation N 1.5 0.5 ).5 OT 2.0 4.0 6.0 8.0 10.0 0.0 -0.5 010 2.0 4.0 6.0 8.0 10.0 12.0 Unemployment Unemployment BLS Data Series Phillips Curves (+ dy 3:21 P 7/4/20 Type here to search O L O W XConditional Format as Cell Delete v Sort & Find & Formatting ~ Table Styles ~ Format Filter Select v Font Alignment Number Styles Cells Editing ... X V fix C D E F G H K M N O P Q Inflation and Unemployment 1948-2020 14.0 12.0 10.0 8.0 6.0 4.0 2.0 0.0 5 7 9 11 13 15 17 19 21 23 25 27 29 31 33 35 37 39 41 43 45 47 49 51 53 55 57 59 61 63 65 67 69 71 73 -2.0 -4.0 Annual Unemployment Inflation BLS Data Series Phillips Curves + COL m W X Type here to search
Step by Step Solution
There are 3 Steps involved in it

Get step-by-step solutions from verified subject matter experts