

Question: 1.Write a computer program to implement the basic Kalman Filter to replicate this scalar example. 2.Expand the program to implement the basic Kalman Filter to
1.Write a computer program to implement the basic Kalman Filter to replicate this scalar example.
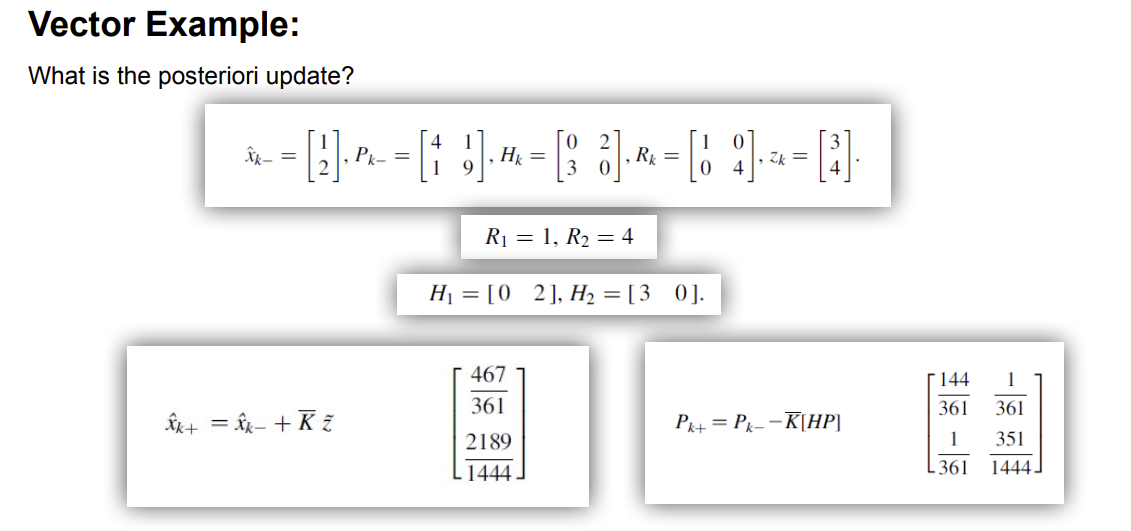
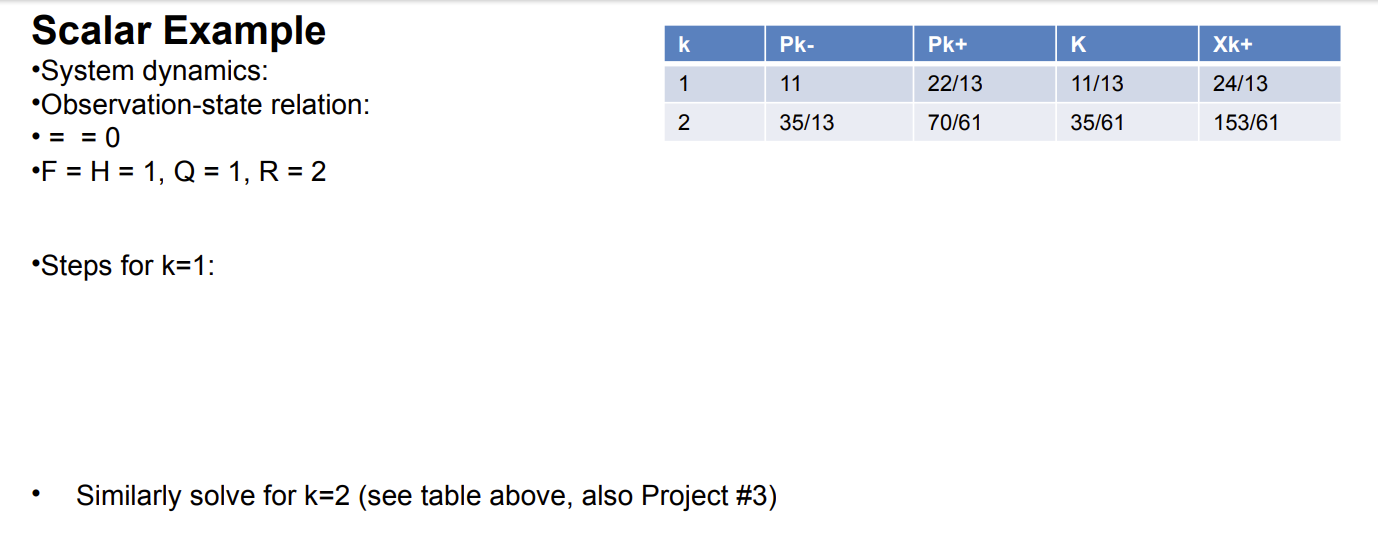
2.Expand the program to implement the basic Kalman Filter to replicate this 2D vector.
3.Using the Apriori (predicted) and the Posteriori (final) levels from the Kalman Filter, demonstrate if they can be used to indicate any bearish or bullish trends and why. No code expected, just theoretical explanation (preferably using any hand-drawn plots as needed) will suffice.
==0F=H=1,Q=1,R=2 - Steps for k=1 : - Similarly solve for k=2 (see table above, also Project \#3) Vector Example: What is the posteriori update? x^k=[12],Pk=[4119],Hk=[0320],Rk=[1004],zk=[34] R1=1,R2=4 H1=[02],H2=[30]. x^k+=x^k+Kz~[36146714442189]Pk+=PkK[HP][361144361136111444351]
Step by Step Solution
There are 3 Steps involved in it

Get step-by-step solutions from verified subject matter experts