

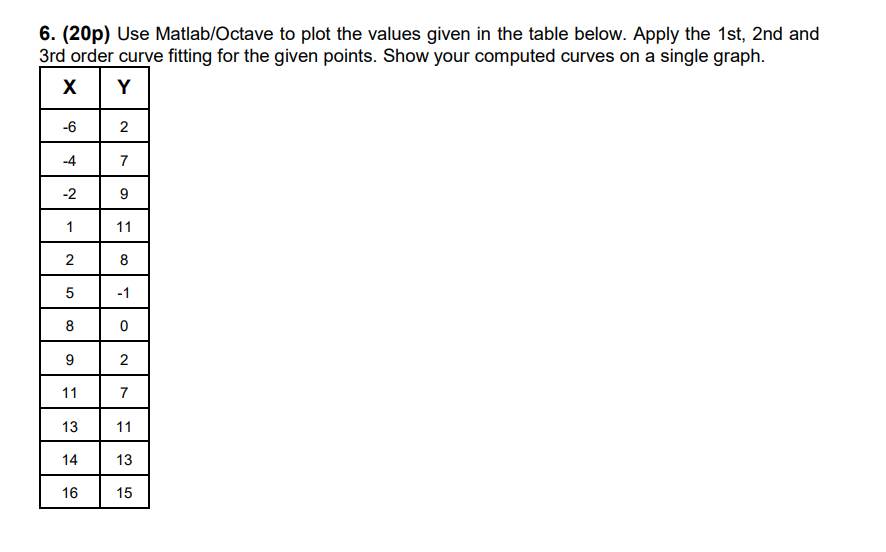
Question: ( 2 0 p ) Use Matlab / Octave to plot the values given in the table below. Apply the 1 st , 2 nd
p Use MatlabOctave to plot the values given in the table below. Apply the st nd and
rd order curve fitting for the given points. Show your computed curves on a single graph.
Step by Step Solution
There are 3 Steps involved in it
1 Expert Approved Answer
Step: 1 Unlock

Question Has Been Solved by an Expert!
Get step-by-step solutions from verified subject matter experts
Step: 2 Unlock
Step: 3 Unlock