

Question: 4. (15 p) Use Matlab/Octave to plot the values given in the table below. Apply the 1st, 2nd and 3rd order curve fitting for the
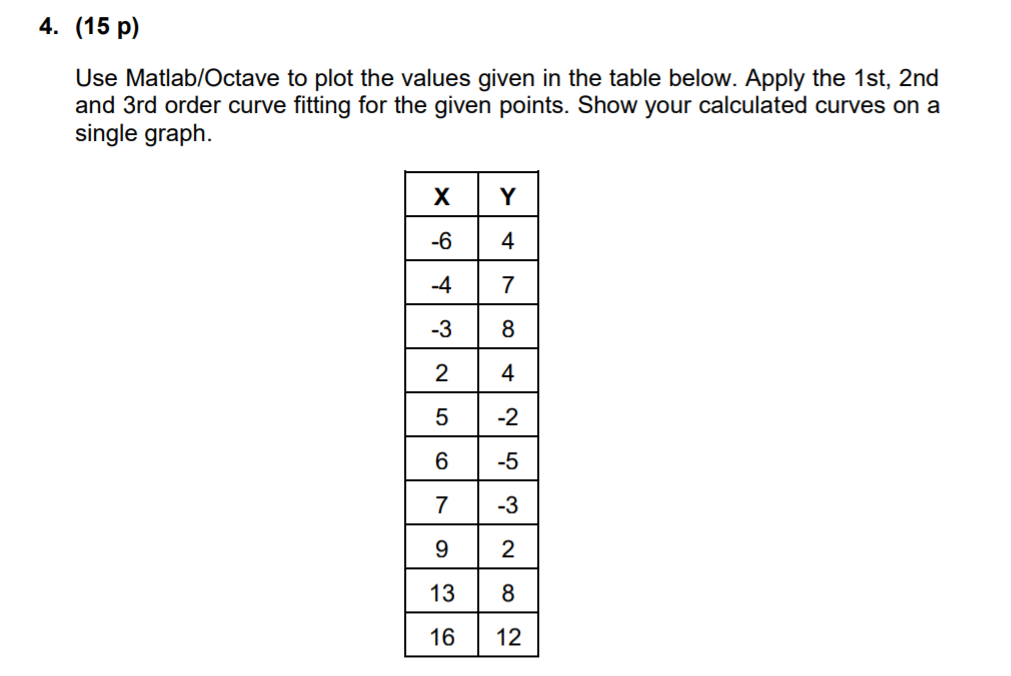
4. (15 p) Use Matlab/Octave to plot the values given in the table below. Apply the 1st, 2nd and 3rd order curve fitting for the given points. Show your calculated curves on a single graph. Y -6 4 -4 7 -3 2 5 -2 No 6 -5 7 -3 9 13 16 12
Step by Step Solution
There are 3 Steps involved in it
1 Expert Approved Answer
Step: 1 Unlock

Question Has Been Solved by an Expert!
Get step-by-step solutions from verified subject matter experts
Step: 2 Unlock
Step: 3 Unlock