

Question: ( 2 0 points ) Use a DePriester chart to generate a temperature - composition diagram ( similar in format to Figure 2 - 3
points Use a DePriester chart to generate a temperaturecomposition diagram similar in format to Figure Wankat for pentane and ethane and at kPa. Specifically:
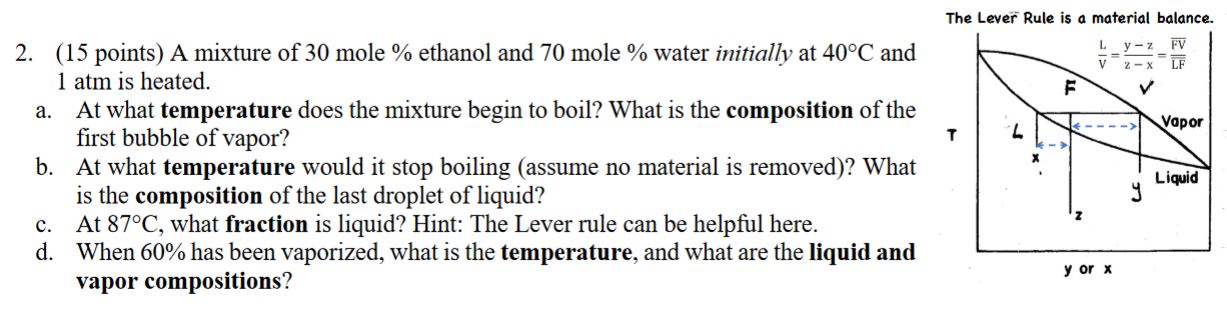
a Use a DePriester chart to generate and submit a table points A mixture of mole ethanol and mole water initially at and
atm is heated.
a At what temperature does the mixture begin to boil? What is the composition of the
first bubble of vapor?
b At what temperature would it stop boiling assume no material is removed What
is the composition of the last droplet of liquid?
c At what fraction is liquid? Hint: The Lever rule can be helpful here.
d When has been vaporized, what is the temperature, and what are the liquid and
vapor compositions?of data with the format shown below. The table is similar in content to Table and is what you will use to construct the temperaturecomposition diagram in b Use downloadable copies of the DePriester charts in Module
table
Step by Step Solution
There are 3 Steps involved in it
1 Expert Approved Answer
Step: 1 Unlock

Question Has Been Solved by an Expert!
Get step-by-step solutions from verified subject matter experts
Step: 2 Unlock
Step: 3 Unlock