

Question: ( 2 0 points ) Use a DePriester chart to generate a temperature - composition diagram ( similar in format to Figure 2 - 3
points Use a DePriester chart to generate a temperaturecomposition diagram similar in format to Figure Wankat for pentane and ethane and at kPa. Specifically:
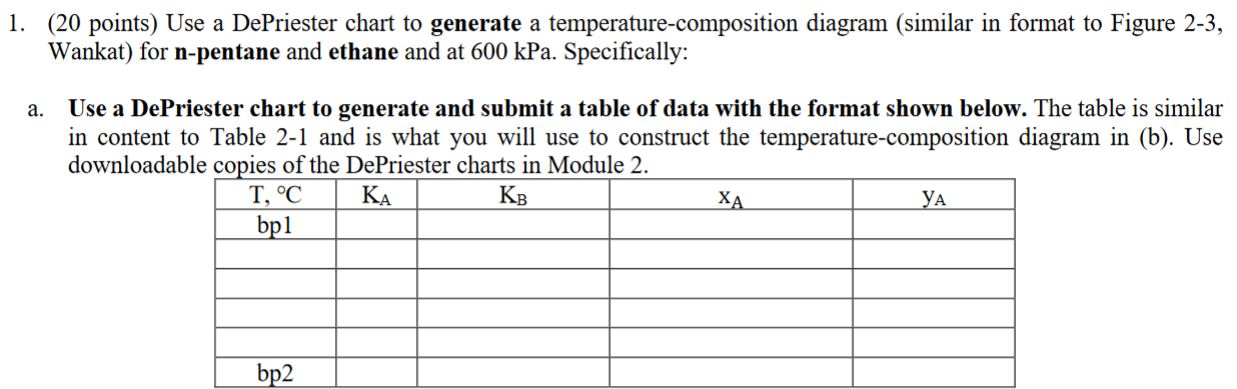
a Use a DePriester chart to generate and submit a table of data with the format shown below. The table is similar in content to Table and is what you will use to construct the temperaturecomposition diagram in b Use downloadable copies of the DePriester charts in Module
table
Step by Step Solution
There are 3 Steps involved in it
1 Expert Approved Answer
Step: 1 Unlock

Question Has Been Solved by an Expert!
Get step-by-step solutions from verified subject matter experts
Step: 2 Unlock
Step: 3 Unlock